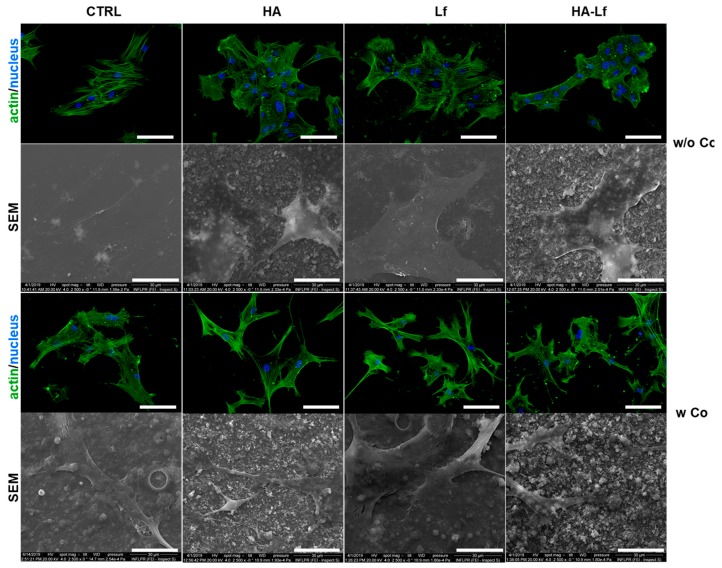
Figure 8.
Representative fields of view of human mesenchymal stem cell adhesion and actin cytoskeleton organisation for each surface obtained by fluorescence microscopy. Cell F-actin (green) and nucleus (blue) were examined using a 20× lens. Scale bar is 100 μm. SEM micrographs were taken with 2500× objectives of hMSCs on substrates. Scale bar represents 30 μm.

