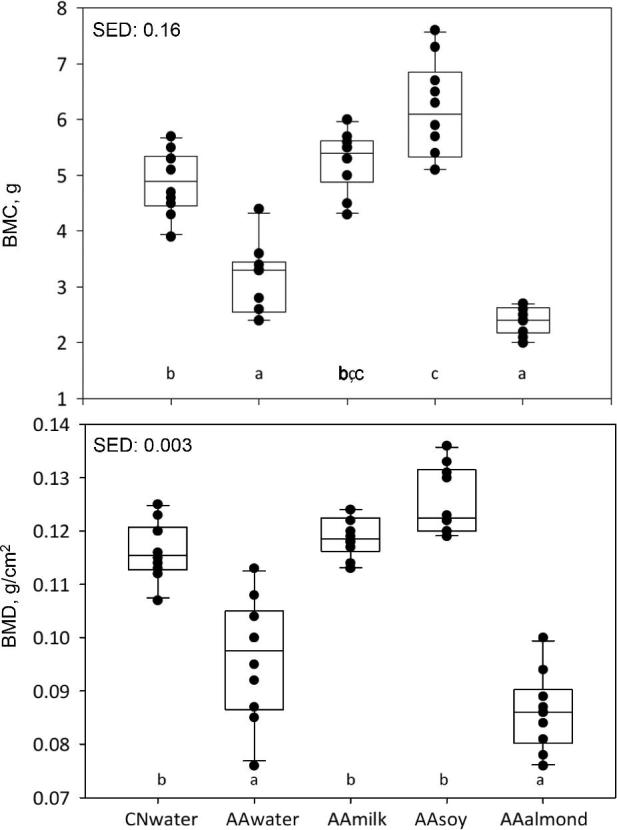
FIGURE 3.

BMC and BMD of live animals measured in week 4 using DEXA. Individual animal values are shown as black circles; group data are represented as box and whisker plots, with SEDs. Data were analyzed by ANOVA, using start weight as a covariate, n = 10/group; boxes without a common letter denote a significant difference (P < 0.05). AA, amino acid; BMC, bone mineral content; BMD, bone mineral density; CN, casein; SED, SE of difference.
