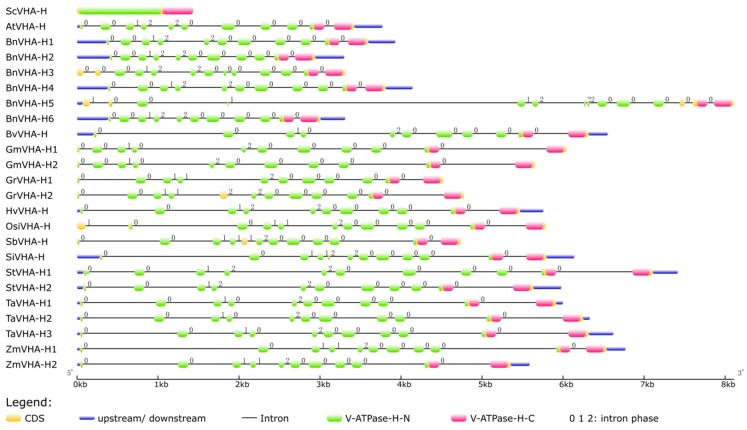
Figure 3.
Exon-intron structures of the 24 VHA-H genes in 12 species of plants and yeast. Exons and introns are illustrated with filled boxes and single black lines, respectively. Conserved protein sequences of V-ATPase-H N-terminal and C-terminal domains are marked in green and pink, respectively, while the rest of the CDS is highlighted in yellow. Untranslated regions (UTRs) are displayed using blue rectangles at both ends of the sequences. Intron phases 0, 1, and 2 are shown on the top left of the black lines. The ruler at the bottom indicates the lengths of the genes in kb.

