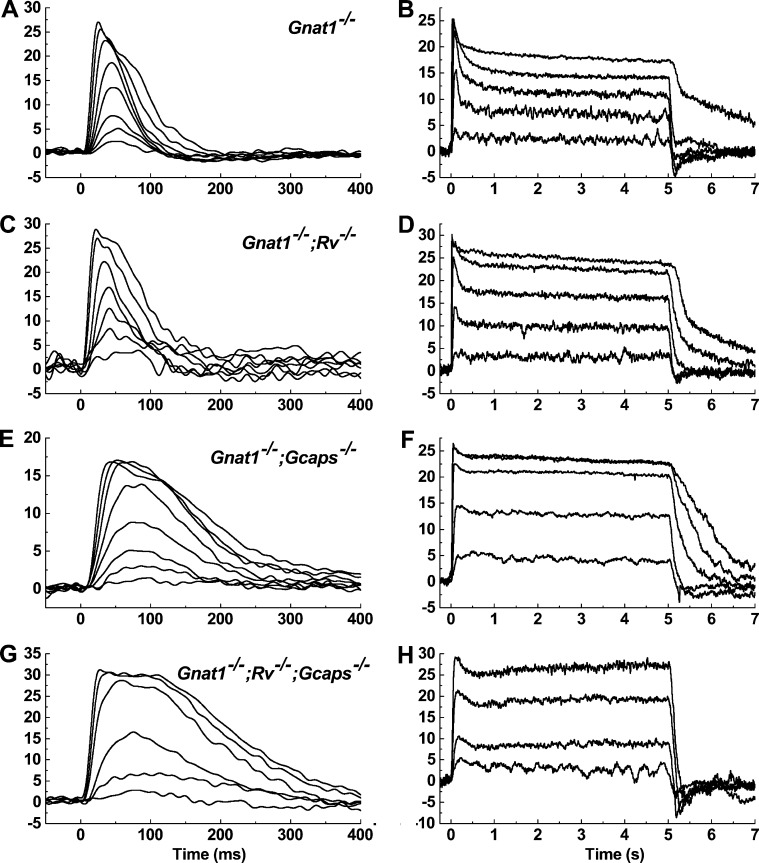
Figure 5.
Flash and step responses from WT cones and cones lacking recoverin and/or the GCAPs. Photocurrents were recorded from transgenic mouse cones: Gnat1−/− (A and B), Gnat1−/−;Rv−/− (C and D), Gnat1−/−;Gcaps−/− (E and F), and Gnat1−/−;Rv−/−;Gcaps−/− (G and H). Stimulus onset was at time = 0 ms. The left column shows current responses from individual, representative cones when exposed to brief flashes of increasing strength (in P*/flash): Gnat1−/− 63–15,000; Gnat1−/−;Rv−/− 190–39,000; Gnat1−/−;Gcaps−/− 76–9,400; Gnat1−/−;Rv−/−; Gcaps−/− 81–7,770. Traces are averages of three to five traces/flash strength. In the right column, the same cones were stimulated with 5 s of steady light at increasing intensities (in P*/s): Gnat1−/− 3,400–1.5 × 10⁶; Gnat1−/−;Rv−/− 3,700–4.0 × 10⁶; Gnat1−/−;Gcaps−/− 4,900–1.03 × 10⁶; Gnat1−/−;Rv−/−;Gcaps−/− 7,500–64,000. Each steady-light intensity was presented two times to limit pigment bleaching.

