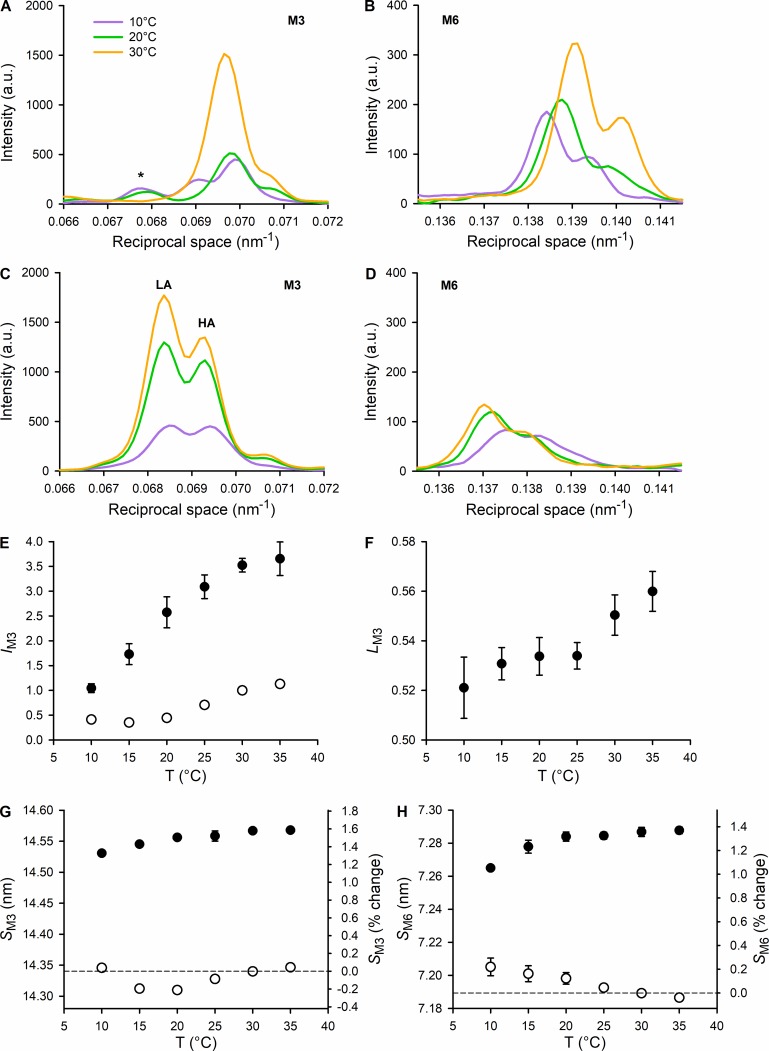
Figure 4.
Temperature dependence of the myosin-based meridional reflections that signal the regulatory state of the thick filament. (A and B) Intensity profiles at rest of the M3 and M6 reflections, at 10°, 20°, and 30°C (color code in the inset). *, A peak present at the lower temperature that is not part of the M3. (C and D) Intensity profiles at the plateau of the isometric tetanus of the M3 and M6 reflections, at 10°, 20°, and 30°C (same color code as in A and B). The two main peaks of M3 fine structure are indicated. All the profiles shown in A–D are obtained from one EDL muscle (the same as in Fig. 2) by adding 2 × 20-ms exposures for each state and each temperature. (E) Temperature (T) dependence of the intensity of the M3 reflection at rest (open circles) and at the plateau of the isometric tetanus (black circles), normalized for the value at rest at 30°C. (F) Temperature dependence of the ratio between the intensity of the LA peak and the total intensity of the M3 (LM3) at the plateau of the isometric tetanus. (G and H) Temperature dependence of the spacing of the M3 and M6 reflections, respectively, at rest (open circles) and at the plateau of the isometric tetanus (black circles). Vertical scale: on the left, nm; on the right, percentage difference from the value at rest at 30°C. Data in E–H are mean ± SEM; six muscles.

