Figure 7.
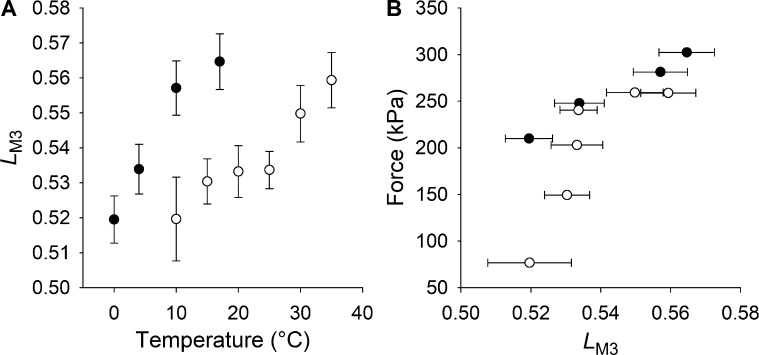
Comparison of the M3 fine structure in frog and mouse muscles. (A) Temperature dependence of the M3 fine structure, measured by LM3 (see text), in frog (filled circles) and mouse (open circles) skeletal muscle. (B) Relation between force and LM3 in isometric tetanic contraction at different temperatures for frog skeletal muscle (filled circles, temperature range 0°–17°C) and for mouse skeletal muscle (open circles, temperature range 10°–35°C). Data are mean ± SEM. The data for frog muscle are from Linari et al. (2005).

