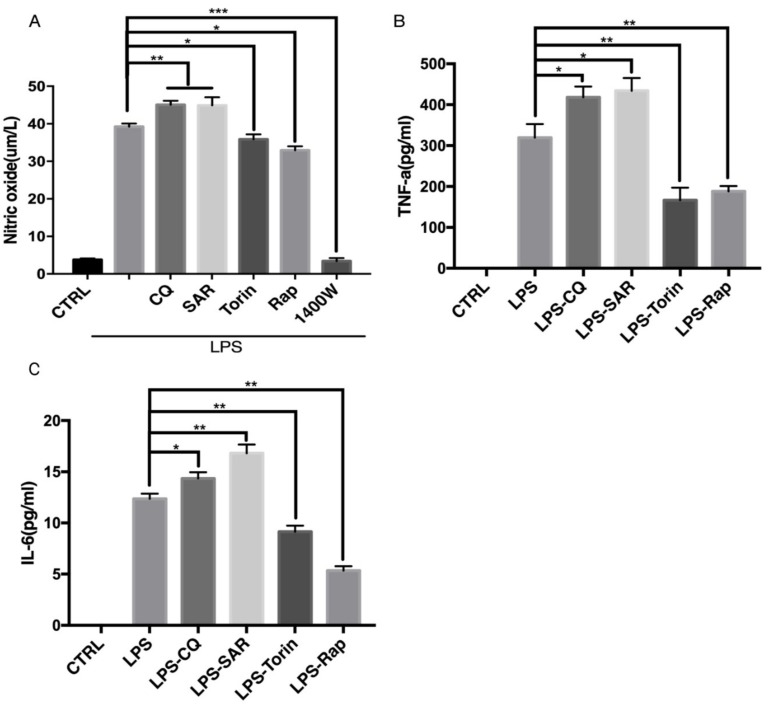
Figure 5.
Regulation of autophagy affects NO production and inflammatory cytokines release. Raw 264.7 cells were treated with LPS (200 ng/mL) 12 h, followed by removing LPS and add CQ (30 µM), SAR (1 µM), Torin (1 µM), Rap (1 µM) 1400 w (100 µM) for another 12 h. (A) Detection of nitric oxide level from Raw 264.7 cells by Griess assay. (B) Detection of TNF-α level by ELISA assay (C) Detection of IL-6 level by ELISA assay. (A–C) CTRL group is blank control group with DMSO treatment. The results were analyzed from three individual experiments by GraphPad Prism, each experiment conducted three times. * p < 0.05, ** p < 0.01, *** p < 0.001. Error bars (mean ± SEM). One-way ANOVA with post hoc tests.

