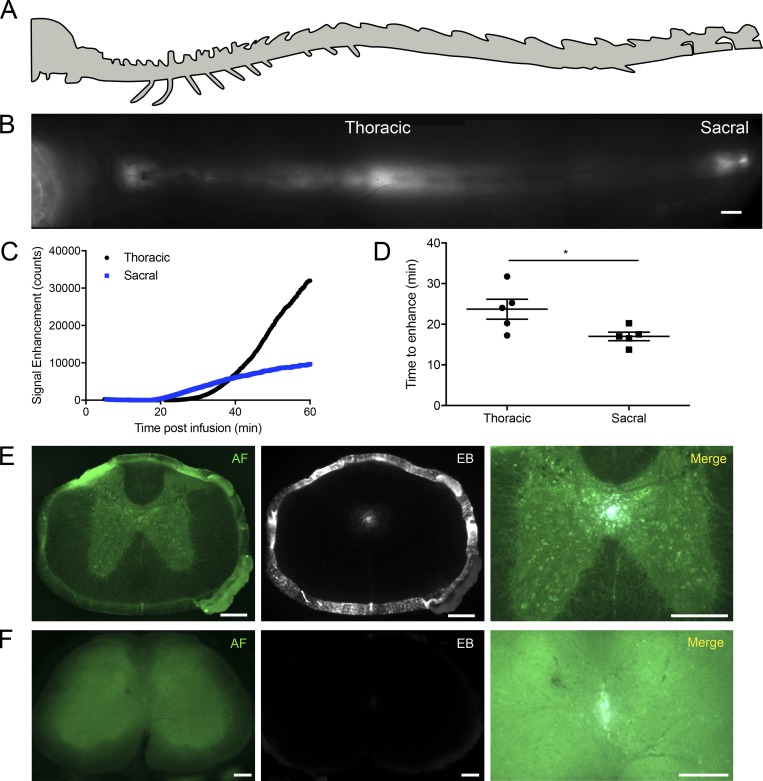
Figure 1.
A rapid flow of tracers occurs down the CC to the sacral spine. (A) Schematic of spine (lateral view). (B) Composite image of the dorsal aspect of the spine demonstrating enhanced tracer signal in the thoracic and sacral regions 1 h after i.c.v. infusion of P40D680. Scale bar, 2 mm. (C) Representative signal dynamics of P40D680 tracer spread to the thoracic (black) and sacral (blue) regions after i.c.v. infusion. (D) Initial time of P40D680 signal enhancement to the thoracic and sacral regions from the i.c.v. infusion site. Data are mean ± SD and representative of two independent experiments (n = 5 each group, two-tailed Student’s t test; *, P < 0.05). (E) Infusions of 0.6% EB i.c.v. were performed, and mice were sacrificed at 30 min. Representative section from the thoracic spinal cord showing the anatomic features from the green autofluorescence (AF) channel and demonstrating EB fluorescence signal in the CC, as well as on the pia mater lining the SAS. Scale bars, 200 µm. (F) Representative section from the lumbar spinal cord demonstrating EB in the CC, with no obvious EB fluorescence apparent in the SAS. Scale bars, 200 µm. Representative of three independent experiments.

