Figure 5.
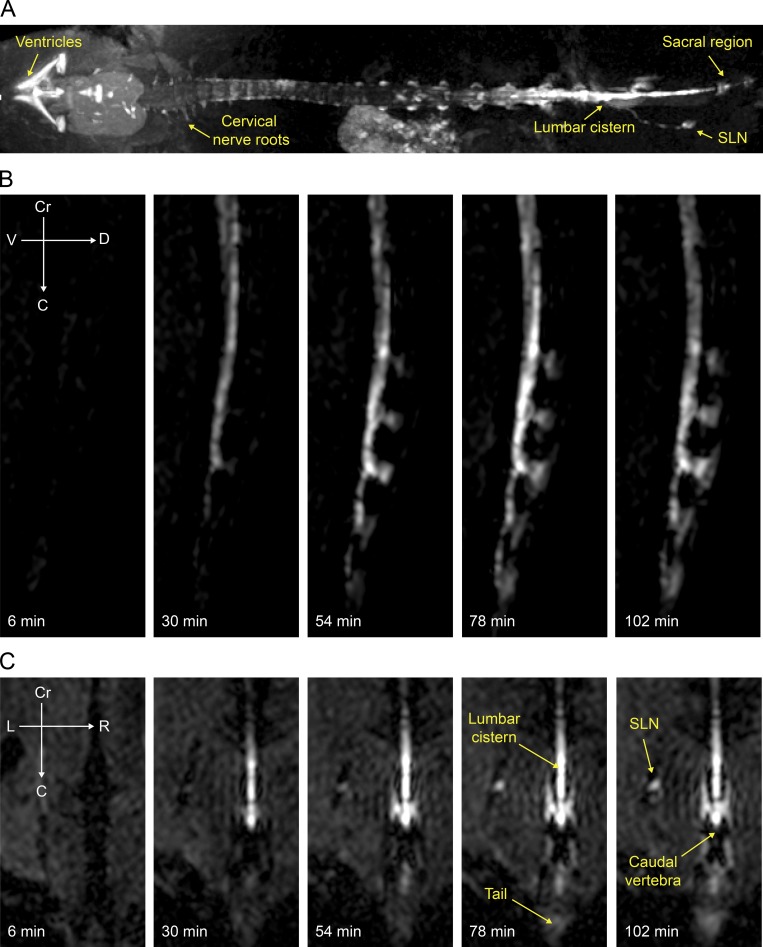
Spinal CSF distribution and sacral lymphatic outflow as detected with MRI. Visualization of tracer spread after low-rate i.c.v. infusion (0.1 µl/min) of Gadospin D solution at 25 mM; data acquired with a series of T1-weighted MRI measurements (3D time-of-flight gradient recalled echo sequence). (A) Representative maximum-intensity projection of enhanced ventricular system and spinal column. (B and C) Representative signal dynamics of Gadospin D contrast agent spread to the caudal end of the spine in sagittal (B) and coronal (C) planes. Enhancement of signal in the sacral LN (SLN) is detectable as early as 30 min. Data are representative of n = 5 mice and three independent experiments.

