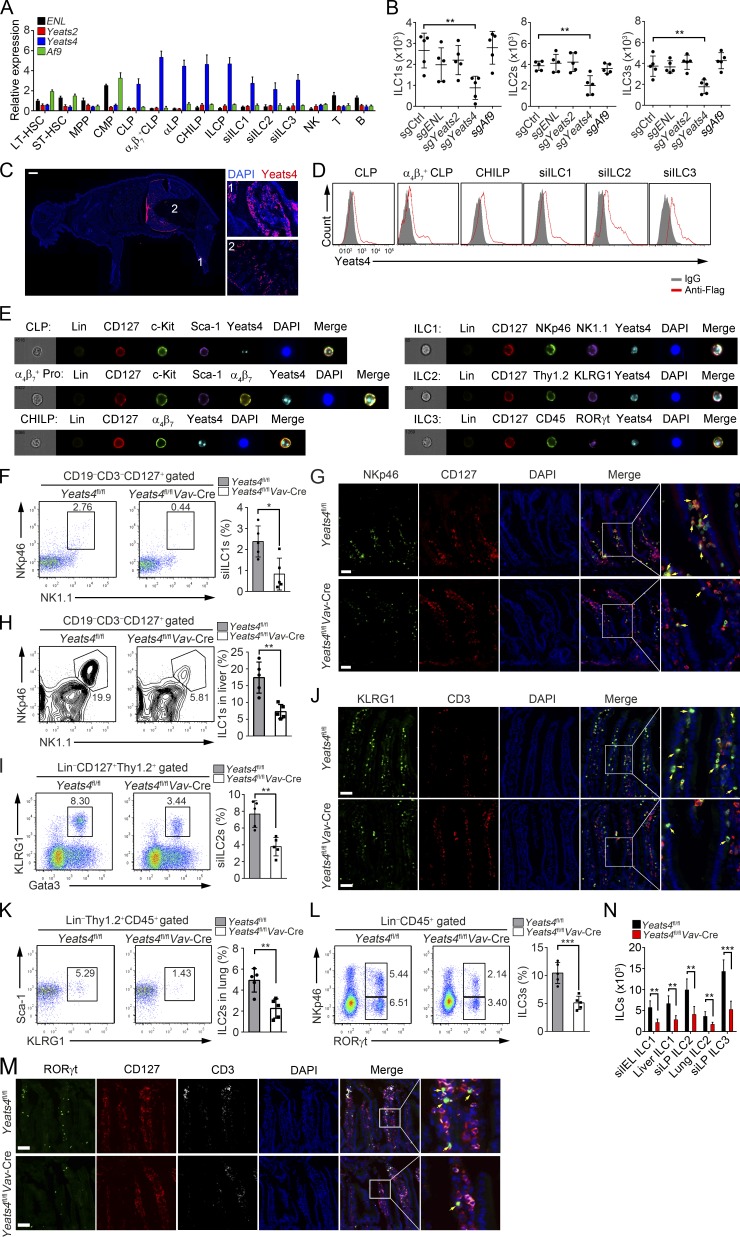
Figure 1.
Yeats4 deficiency causes a reduction in ILC numbers. (A) Relative mRNA expression levels of ENL, Yeats2, Yeats4, and Af9 in different hematopoietic cells were examined by qPCR. All hematopoietic cells were isolated by FACS, and total RNA was extracted for qPCR. Fold changes were normalized to endogenous Actb. LT-HSCs (Lin−c-Kit+Sca-1+CD150+CD48−), ST-HSCs (Lin−c-Kit+Sca-1+CD150−CD48−), MPPs (Lin−c-Kit+Sca-1+CD150−CD48+), CMPs (Lin−c-Kit+Sca-1−CD34+CD16/32−), CLPs (Lin−CD25−CD127+c-KitintSca-1intFlt3+α4β7−), α4β7+ CLPs (Lin−CD25−CD127+c-KitintSca-1intFlt3+α4β7+), αLP (Lin−CD25−CD127+c-KitintSca-1intFlt3−α4β7+), CHILPs (Lin−CD25−CD127+Flt3−α4β7+Id2+), and ILCPs (Lin−CD127+Flt3−c-Kit+α4β7+PLZF+) were isolated from BM cells. ILC1s (CD3−CD19−CD127+NK1.1+NKp46+), ILC2s (Lin−CD127+Thy1.2+KLRG1+Gata3+), and ILC3s (Lin−CD45+RORγt+) were isolated from the small intestine. NK cells (NK1.1+) and B cells (CD19+) were isolated from the spleen. T cells (CD3+) were isolated from the thymus. (B) α4β7+ CLPs (Lin−CD25−CD127+c-KitintSca-1intFlt3+α4β7+) were isolated from 129-Gt(ROSA)26Sortm1(CAG-cas9*,-EGFP)FezhVav-Cre mice and infected with lentiCRISPRv2 containing sgRNA lentiviruses against ENL, Yeats2, Yeats4, or Af9 for gene deletion, followed by an in vitro differentiation assay. (C) 7-d-old Yeats4Flag mice were sacrificed for longitudinal sections and stained with anti-Flag antibody. A global view of section is shown in the left panel, and the indicated tissues are presented in the right panels. 1, BM; 2, intestine. Scale bar, 1,000 µm. (D) Yeats4Flag knockin mice were analyzed by FACS. (E) Imaging flow cytometry analysis for Yeats4 expression in indicated ILCs and their progenitors from Yeats4Flag knockin mice. For CHILP staining, Lin− populations contained both Flt3- and CD25-negative cells. Lineage cocktail antibodies contained anti-CD3 and anti-CD19 for ILC1 staining. α4β7+ Pro indicates α4β7+ progenitors, consisting of α4β7+ CLPs and αLPs. (F) Percentages of ILC1s (CD3−CD19−CD127+NK1.1+NKp46+) in small intestines from Yeats4fl/fl and Yeats4fl/flVav-Cre mice were analyzed by FACS. Percentages of indicated cells were calculated and shown in the right panel. n = 5 per group. (G) ILC1s (CD127+NKp46+) in small intestines from Yeats4fl/fl and Yeats4fl/flVav-Cre mice were visualized by in situ immunofluorescence staining. Arrows denote ILC1 cells. Scale bars, 50 µm. (H) Percentages of ILC1s in livers derived from Yeats4fl/fl and Yeats4fl/flVav-Cre mice were examined by FACS. Percentages of indicated cells were calculated and shown in the right panel. n = 5 per group. (I) Percentages of ILC2s (Lin−CD127+Thy1.2+KLRG1+Gata3+) in small intestines from Yeats4fl/fl and Yeats4fl/flVav-Cre mice were examined by FACS. Percentages of indicated cells were calculated and shown in the right panel. n = 5 per group. (J) ILC2s (CD3−KLRG1+) in small intestines from Yeats4fl/fl and Yeats4fl/flVav-Cre mice were visualized by in situ immunofluorescence staining. Arrows denote ILC2 cells. Scale bars, 50 µm. (K) Percentages of ILC2s (Lin−CD45+Thy1.2+KLRG1+Sca-1+) in lungs from Yeats4fl/fl and Yeats4fl/flVav-Cre mice were examined by FACS. Percentages of indicated cells were calculated and shown in the right panel. n = 5 per group. (L) Percentages of ILC3s (Lin−CD45+RORγt+) in small intestines from Yeats4fl/fl and Yeats4fl/flVav-Cre mice were examined by FACS. Percentages of indicated cells were calculated and shown in the right panel. n = 5 per group. (M) ILC3s (CD3−CD127+RORγt+) in small intestines from Yeats4fl/fl and Yeats4fl/flVav-Cre mice were visualized by in situ immunofluorescence staining. Arrows denote ILC3 cells. Scale bars, 50 µm. (N) Numbers of indicated ILCs were calculated. *, P < 0.05; **, P < 0.01; ***, P < 0.001 by two-tailed unpaired Student’s t test. All data are representative of at least three independent experiments and are expressed as mean ± SD.

