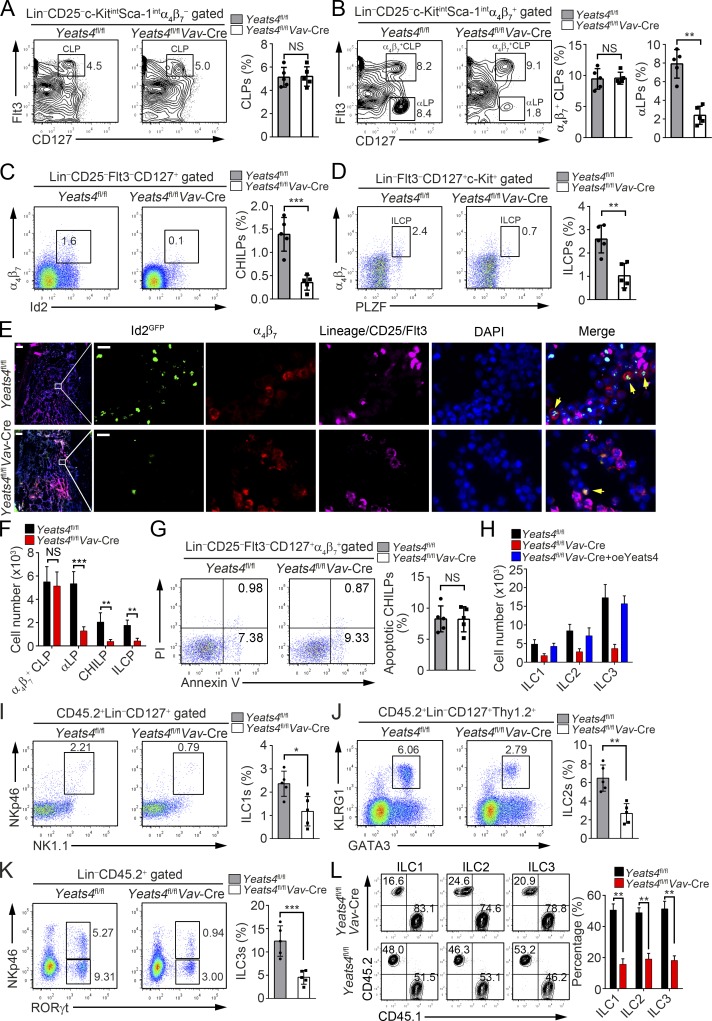
Figure 3.
Yeats4 directs α4β7+ CLPs to ILC lineage differentiation. (A–D) Analysis of CLPs, α4β7+ CLPs, αLPs, CHILPs, and ILCPs from Yeats4fl/fl and Yeats4fl/flVav-Cre mice by FACS. Percentages of indicated cells were calculated and shown in the right panel. n = 5 per group. (E) CHILPs (Lin−CD25−Flt3−α4β7+Id2GFP) in BM from Yeats4fl/flId2+/GFP and Yeats4fl/flVav-CreId2+/GFP mice were visualized by in situ immunofluorescence staining. Arrows denote CHILP cells. Scale bars, 100 µm (left) and 10 µm (right). (F) Numbers of indicated cells from Yeats4fl/fl and Yeats4fl/flVav-Cre mice were calculated. n = 5 per group. (G) Analysis of cell apoptosis in CHILPs (Lin−CD25− Flt3−CD127+α4β7+) from Yeats4fl/fl and Yeats4fl/flVav-Cre mice. n = 5 per group. (H) 5 × 10³ Yeats4-overexpressing α4β7+ CLPs isolated from Yeats4fl/flVav-Cre mice were engrafted into Rag1−/−Il2rg−/− mice. After 6 wk, ILCs in the small intestine were analyzed by FACS. (I–K) 5 × 10⁴ CD45.2+ LSKs from Yeats4fl/fl and Yeats4fl/flVav-Cre mice with 5 × 10⁶ CD45.1+ helper BM cells were transplanted into lethally irradiated CD45.1+ recipients. After 8 wk, percentages of ILC1s (I), ILC2s (J), and ILC3s (K) in small intestines from chimeras were tested by FACS. n = 5 for each group. (L) A 50/50 mixture of CD45.1+ WT and CD45.2+ Yeats4fl/fl or Yeats4fl/flVav-Cre BM was transplanted into lethally irradiated CD45.1+ recipients. Ratios of CD45.1+ to CD45.2+ CHILPs, ILC1s, ILC2s, or ILC3s in chimeras (n = 5) were analyzed. *, P < 0.05; **, P < 0.01; ***, P < 0.001 by two-tailed unpaired Student’s t test. All data are representative of at least three independent experiments and are expressed as mean ± SD.

