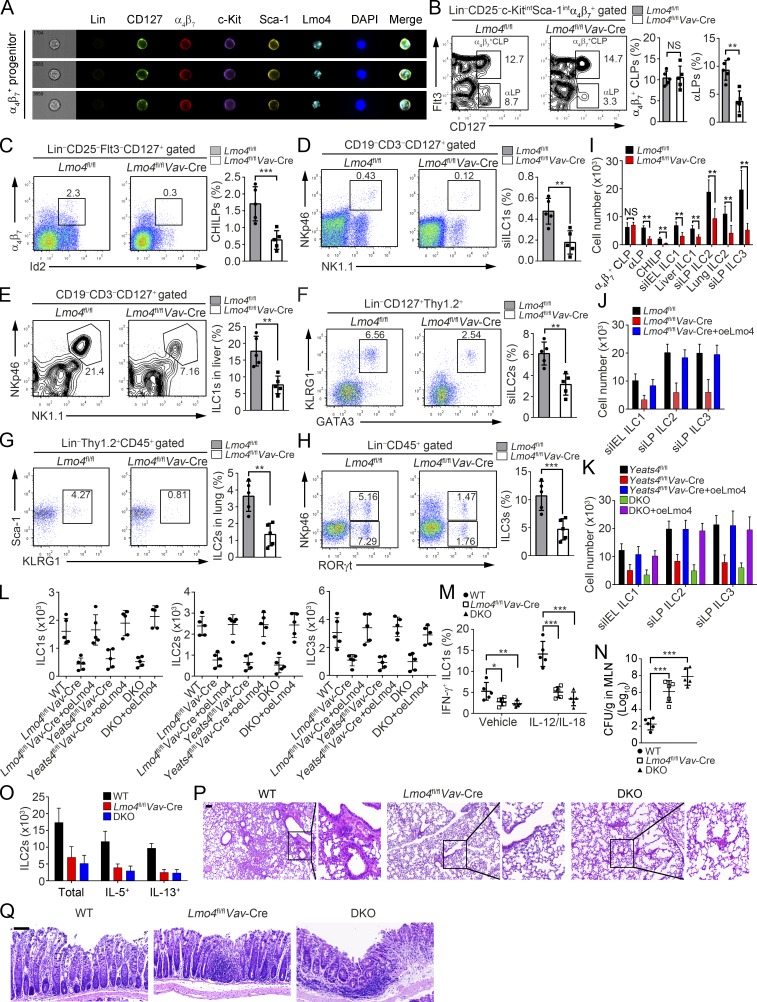
Figure 6.
Lmo4 deficiency impairs ILC commitment and their effector functions. (A) Imaging flow cytometry analysis for Lmo4 expression in α4β7+ progenitors. (B–H) Percentages of α4β7+ CLPs (B), αLPs (B), CHILPs (C), siILC1s (D), liver ILC1s (E), siILC2s (F), lung ILC2s (G), and siILC3s (H) in Lmo4fl/fl and Lmo4fl/flVav-Cre mice were tested by FACS. n = 5 per group. (I) Numbers of indicated cells in Lmo4fl/fl and Lmo4fl/flVav-Cre mice were calculated. (J) Lmo4-overexpressing α4β7+ CLPs isolated from Lmo4fl/flVav-Cre mice were engrafted into Rag1−/−Il2rg−/− mice. After 6 wk, ILCs were analyzed by FACS. (K) Lmo4-overexpressing α4β7+ CLPs isolated from Yeats4fl/flVav-Cre or DKO mice were injected into Rag1−/−Il2rg−/− mice and assayed in J. (L) α4β7+ CLPs from indicated mice were isolated and used for in vitro differentiation assay with OP9 feeder cells. After 12-d culture, ILC1s, ILC2s, and ILC3s were analyzed. (M) Frequencies of IFN-γ+ ILC1s in MLNs from WT, Lmo4fl/flVav-Cre, or DKO mice infected with S. typhimurium were analyzed on day 5 after injection. n = 5 per group. (N) CFUs of S. typhimurium were measured in MLNs from WT, Lmo4fl/flVav-Cre, or DKO mice on day 5 after infection. n = 5 per group. (O) Total numbers of ILC2s and IL-5+ or IL-13+ ILC2s were analyzed in lungs from WT, Lmo4fl/flVav-Cre, or DKO mice after papain challenge. n = 5 per group. (P) H&E staining of lung sections from WT, Lmo4fl/flVav-Cre, or DKO mice treated with papain. Scale bars, 100 µm. (Q) Colons from challenged WT, Lmo4fl/flVav-Cre, or DKO mice were analyzed by H&E staining. Scale bars, 50 µm. n = 5 per group. **, P < 0.01; ***, P < 0.001 by two-tailed unpaired Student’s t test. All data are representative of at least three independent experiments and are expressed as mean ± SD.

