Figure 3.
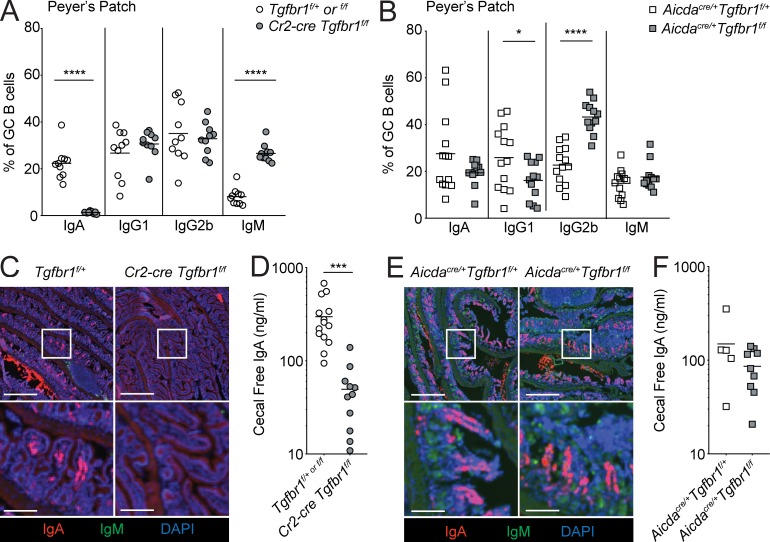
IgA induction does not require TGFβ signaling in PP GCs. (A and B) Percentages of CD45.2+ GCBs staining positive for IgA, IgG1, IgG2b, or IgM in PPs from mixed bone marrow chimeras generated with a mixture of 70% WT (CD45.1/2) and 30% CD45.2 bone marrow that was Tgfbr1f/+ or f/f or Cr2-cre Tgfbr1f/f or Aicdacre/+ Tgfbr1f/+ or Aicdacre/+ Tgfbr1f/f assessed by FACS. Data in A are pooled from two independent experiments with four to five mice per group. Data in B are pooled from three independent experiments with three to five mice per group. (C) Immunofluorescence of sections of small intestine from Tgfbr1f/+ or Cr2-cre Tgfbr1f/f animals stained for IgA (red), IgM (green), and DAPI (blue). Scale bars: 500 μm in low-power images and 125 μm in insets. (D) IgA in cecal contents of Cr2-cre Tgfbr1f/f animals or littermate controls measured by ELISA. (E) Immunofluorescence of sections of small intestine from Aicdacre/+ Tgfbr1f/+ or Aicdacre/+ Tgfbr1f/f animals stained as in C. Scale bars: 500 μm in low-power images and 125 μm in insets. (F) IgA in cecal contents of Aicdacre/+ Tgfbr1f/+ or Aicdacre/+ Tgfbr1f/f measured by ELISA. Data in C and E are representative of three mice of each type from three independent experiments (see Fig. S2 for additional examples). Data in D and F are pooled data from three and two independent experiments, respectively, with 14, 11, 5, and 9 total animals of each type. *, P < 0.05; ***, P < 0.001; ****, P < 0.0001; unpaired two-tailed Student’s t test.

