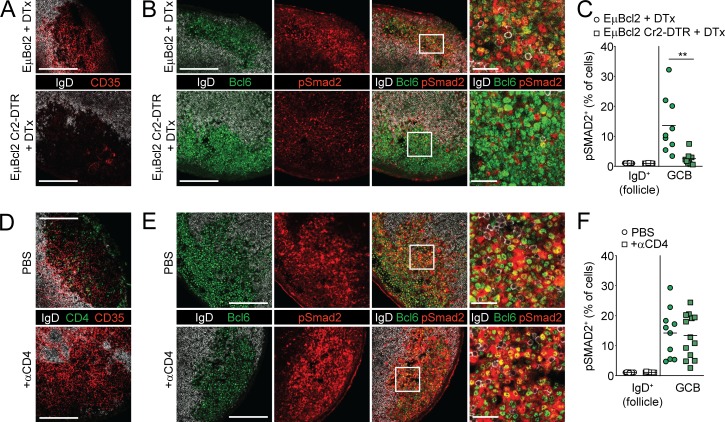
Figure 8.
FDCs promote TGFβ signaling in GCBs. (A–C) Immunofluorescence of PPs from lethally irradiated Cr2-DTR or control animals that were reconstituted with EμBCL2 bone marrow and were treated with DTx 18 h before sacrifice and stained with IgD, Bcl6, and CD35 (A) or IgD, Bcl6, and pSmad2 (B). Histocytometric analysis of pSmad2 staining is shown in C. Data in A and B are representative of and C is pooled from three and four mice per group with one to three PP GCs analyzed per mouse from two independent experiments. Each dot represents one GC. (D–F) Immunofluorescence of PPs from WT animals that were treated 1 d previously with PBS or 200 μg anti-CD4 depleting antibody and stained for IgD, CD35, and CD4 (D) or IgD, Bcl6, and pSmad2 (E). Histocytometric analysis of pSmad2 staining is shown in F. Data in D and E are representative of and in F is pooled from three mice per group with three to five PP GCs analyzed per mouse from two independent experiments. Each dot represents one PP. Scale bars: 150 μm in images of total GC and 25 μm in enlarged sections of GC. **, P < 0.01; unpaired two-tailed Student’s t test.

