Figure 1.
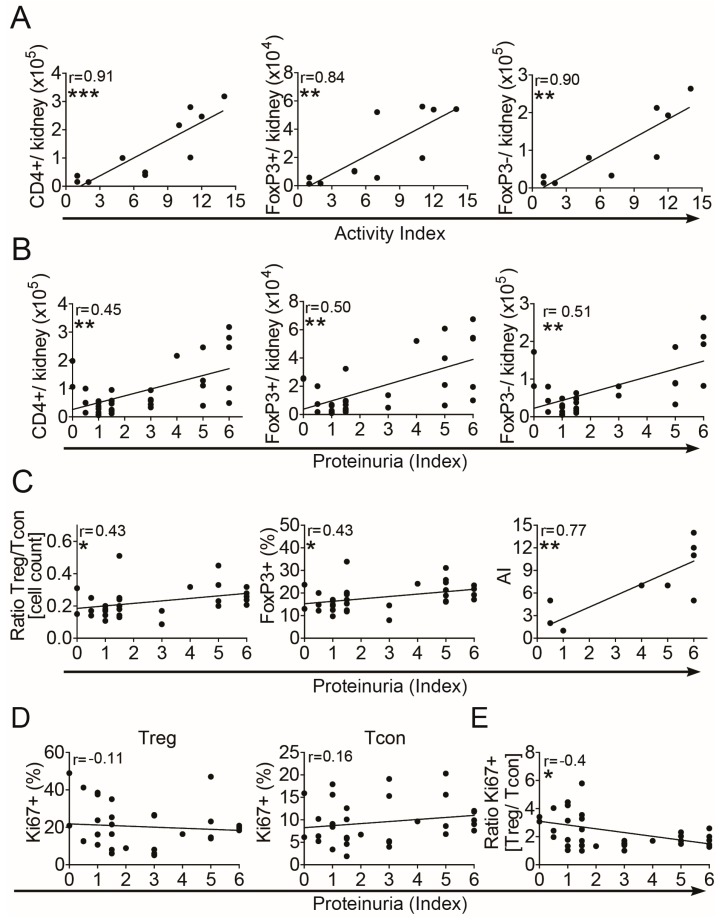
Progressive Treg/Tcon imbalance during progression of lupus nephritis. Cells from kidneys of (NZB × NZW) F1 mice at different disease stages were analyzed by flow cytometry. (A,B) Absolute numbers of total intrarenal CD4+ T cells, of intrarenal CD4+FoxP3+ Treg and of intrarenal CD4+FoxP3− Tcon in correlation with the renal histomorphological activity index (AI) (A) and with the proteinuria index (B). (C) Graphs show the correlation of the calculated ratio between absolute numbers of CD4+FoxP3+ Treg and CD4+FoxP3− Tcon (left graph), the correlation of the percentages of FoxP3+ cells among CD4+ T cells (middle graph) and the correlation of the AI with the proteinuria index (right graph). (D) The percentage of intrarenal Ki67+ cells among CD4+FoxP3+ Treg (left graph) and among CD4+FoxP3− Tcon (right graph) is shown. (E) The calculated ratio between percentages of Ki67+ Treg and of Ki67+ Tcon in correlation with the proteinuria index is shown. Data are derived from one kidney of each mouse from two to five independent experiments (n = 10 for correlations with AI; n = 28–30 for correlations with proteinuria index). Correlation analyses were performed by using Spearman’s rank correlation coefficients. Black lines indicate linear regression curves using Pearson analyses (* p < 0.05, ** p < 0.01 and *** p < 0.001).

