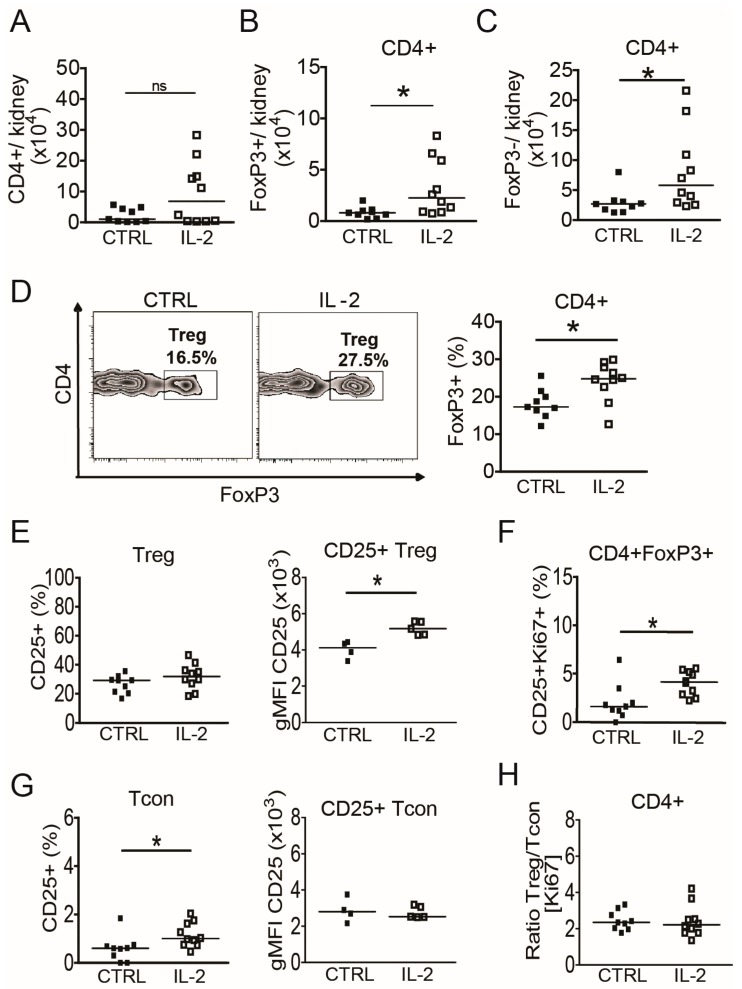
Figure 4.
Short-term IL-2 treatment expands the intrarenal Treg population. Cells from kidneys of (NZB × NZW) F1 mice at the disease onset were analyzed by flow cytometry 24 h after a 5-day treatment course with daily injections of rIL-2 and compared with PBS-treated control mice. (A–C) Total numbers of intrarenal CD4+ T cells (A), of intrarenal CD4+FoxP3+ Treg (B) and of intrarenal CD4+FoxP3- Tcon (C) from IL-2 treated mice (IL-2) compared to control mice (CTRL) are shown. (D) Representative contour plots and scatter plot show the frequencies of FoxP3+ cells among CD4+ T cells in IL-2 treated mice compared to controls. (E) The frequency of CD25+ cells among CD4+FoxP3+ Treg and the geometric mean fluorescence intensity (gMFI) of CD25 in CD4+FoxP3+CD25+ Treg are shown. (F) The percentage of intrarenal CD25+Ki67+ cells among CD4+FoxP3+ Treg is shown. (G) The frequency of CD25+ cells among CD4+FoxP3− Tcon and the gMFI of CD25 in CD4+FoxP3-CD25+ Tcon are shown. (H) The calculated ratio between percentages of Ki67+ Treg and of Ki67+ Tcon is shown. Filled squares indicate PBS treated control mice (CTRL, n = 9) and open squares represent IL-2 treated mice (IL-2, n = 10). Horizontal lines represent the median. Mann-Whitney U test was used for statistical analyses (* p < 0.05).

