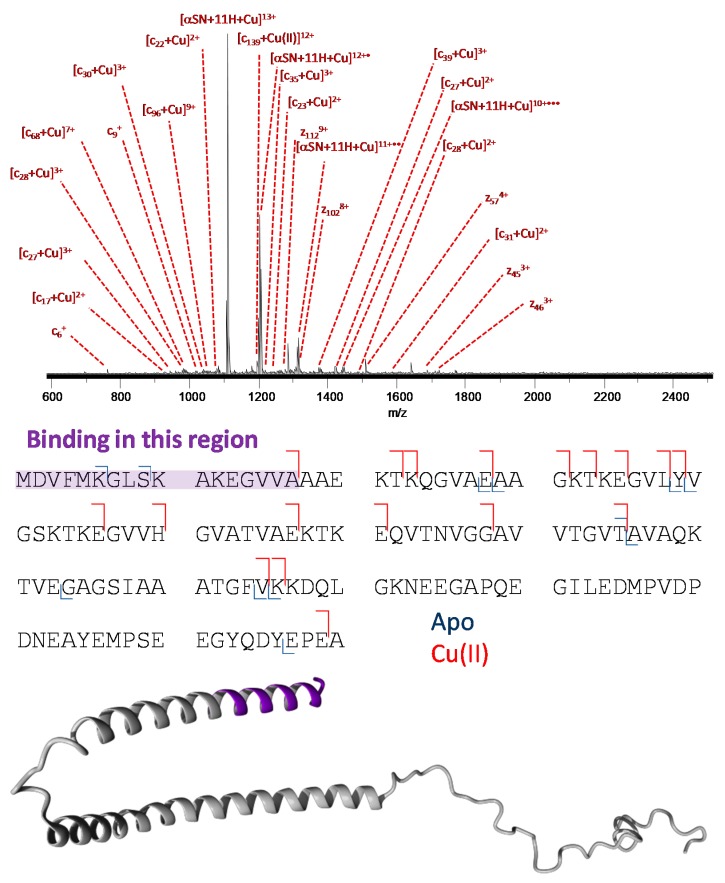
Figure A4.
Tandem MS analysis of the [α-syn + Cu(II)] complex, showing the results from electron capture dissociation (ECD) fragmentation of [α-syn + 11H + Cu(II)]13+. The fragments are summarized below the mass spectrum, and the possible binding region is indicated. A 3D structural representation of α-syn is shown at the bottom, with the possible binding region colored purple.

