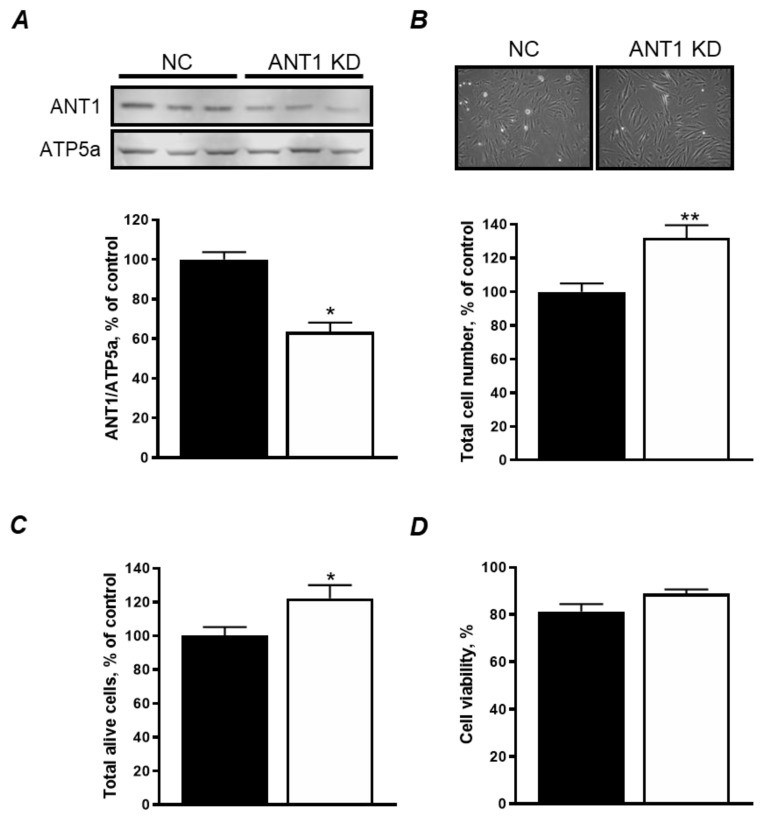
Figure 1.
Cell viability is not affected by ANT KD in H9c2 cells. (A) Protein levels of ANT1 in negative control (NC) and ANT1 KD cells. Top panel: representative immunoblots. Bottom panel: quantitative data of ANT1 protein expression normalized to ATP5a (a mitochondrial housekeeping protein); (B) Total number of cells 48 h after transfection. Top panel: representative images of cells. Bottom panel: quantitative data of cells; (C) total number of live cells 48 h after transfection; (D) cell viability 48 h after transfection calculated as (alive cells/total cells) × 100. * P < 0.05 and ** P < 0.001 vs. NC. Data represent 4–7 independent experiments.

