Figure 1.
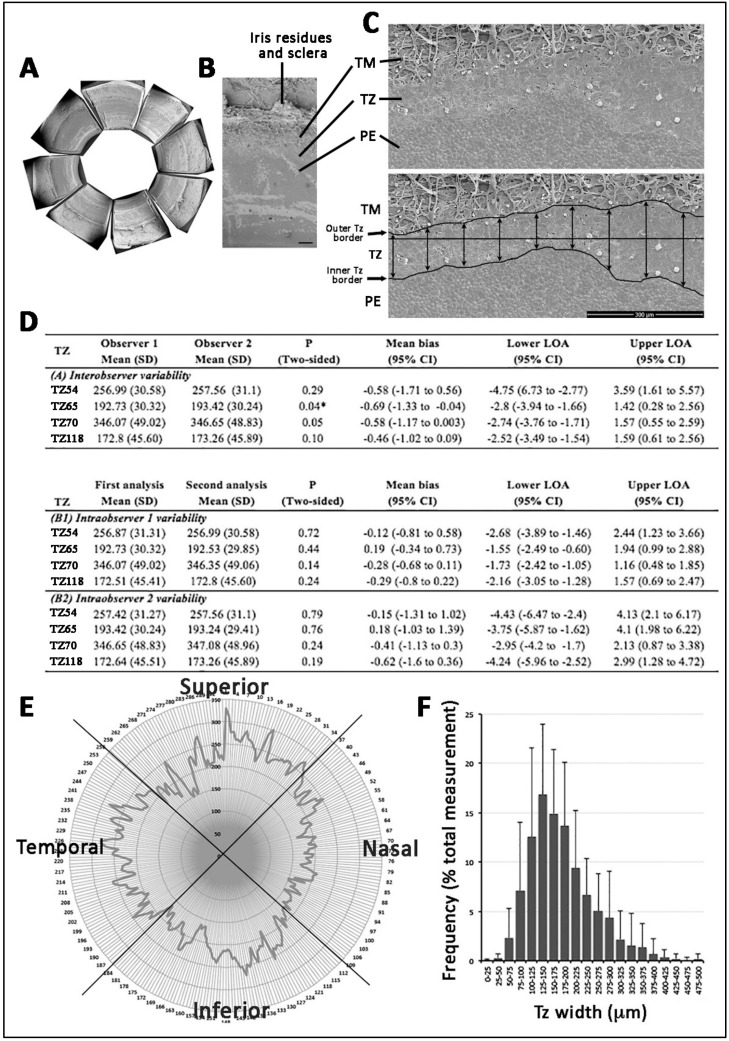
Human transition zone (TZ) morphology under scanning electron microscopy and TZ width profile. (A) Corneal periphery cut into equal pieces. (B) A magnified view showing regions of trabecular meshwork (TM), TZ and peripheral endothelium (PE). (C) Flat-mount view at 300× magnification and TZ outline with posterior border at insertions of uveal bands into TM and anterior border of polygonal-shaped endothelial cells. At every 100 μm interval, a vertical line was made between the inner and outer borders for TZ width measurement. (D) Inter- and intra-observer agreement of TZ width measurement. LOA: level of agreement. (E) 360° TZ width profile with respect to eye orientation. Nasal quadrant had the narrowest TZ. (F) A frequency plot of TZ width distribution. A dominant TZ width at 125 to 150 μm (15% coverage of overall TZ widths). Scale bar: 300 μm (B and C).

