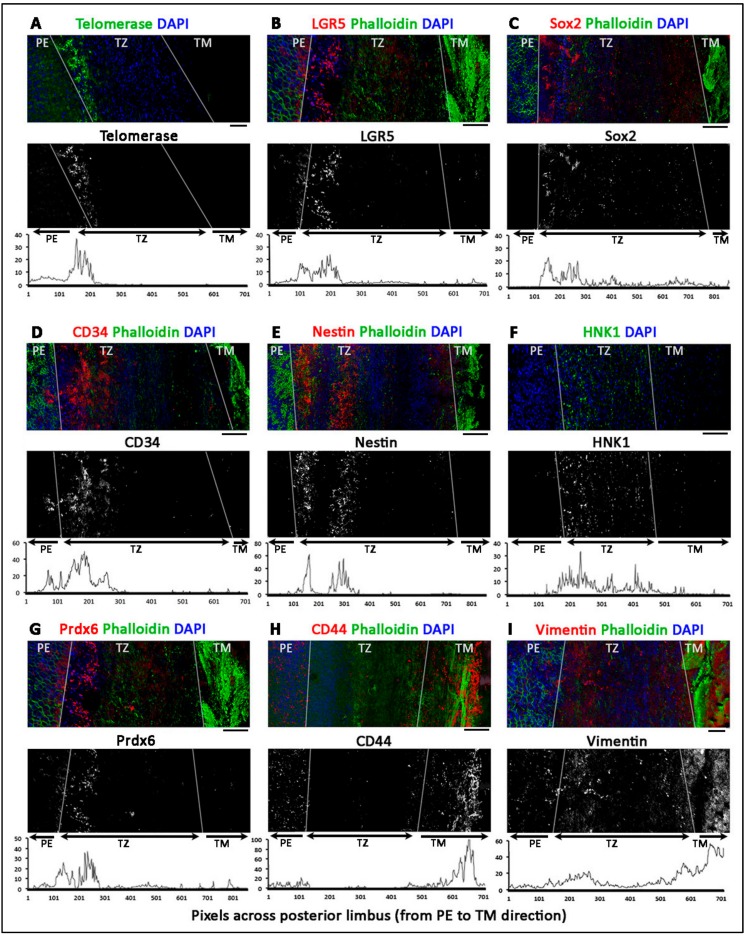
Figure 3.
Z-series reconstructed confocal images showing the expression of stem cell markers in human transition zone (TZ), peripheral endothelium (PE) and trabecular meshwork (TM). The expression of (A) telomerase (TERT), (B) Lgr5, (C) Sox2, (D) CD34, (E) nestin and (G) Prdx6 were more expressed in the inner TZ. (F) HNK1 and (I) vimentin were detected in the entire TZ region. In contrast, outer TZ and TM had (H) CD44 and vimentin signal. White lines delineate borders between TM, TZ and PE. The top images represent the original colored confocal pictures, the middle grey-scaled images are single antibody-specific channel after threshold adjustment and the bottom graphs are the signal intensity profiles from PE across TZ to TM (x-axis represents distance in pixels and y-axis is the relative intensity levels). Scale bars: 50 μm.

