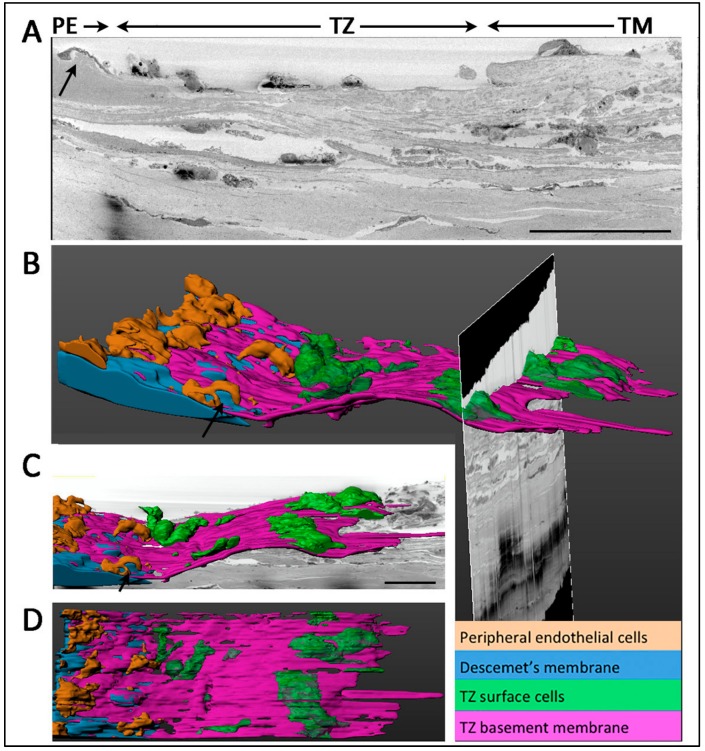
Figure 7.
Serial block face-scanning electron microscopy of junction between transition zone (TZ) and peripheral endothelium (PE) and 3D reconstruction. (A) Representative TEM slice showing an overview of PE/TZ junction. Arrows show the presence of Hassall-Henle structure at extreme peripheral Descemet’s membrane (DM). (B) 3D reconstructed image of TZ/PE junction showing DM insertion below TZ surface. (C) 3D reconstructed image showing TZ surface cells. (D) En face view showing the distribution of PE and TZ surface cells. Scale bars: 50 μm.

