Figure 2.
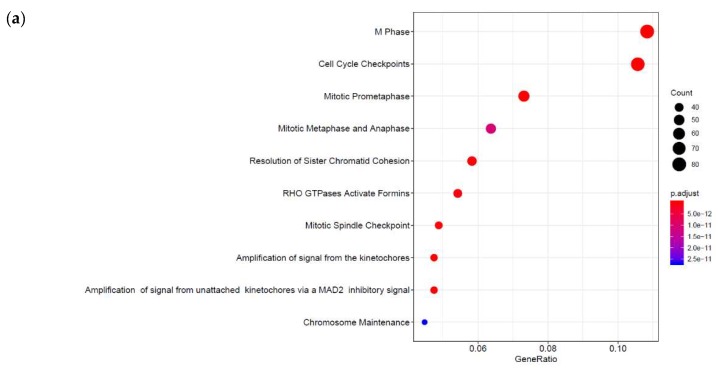
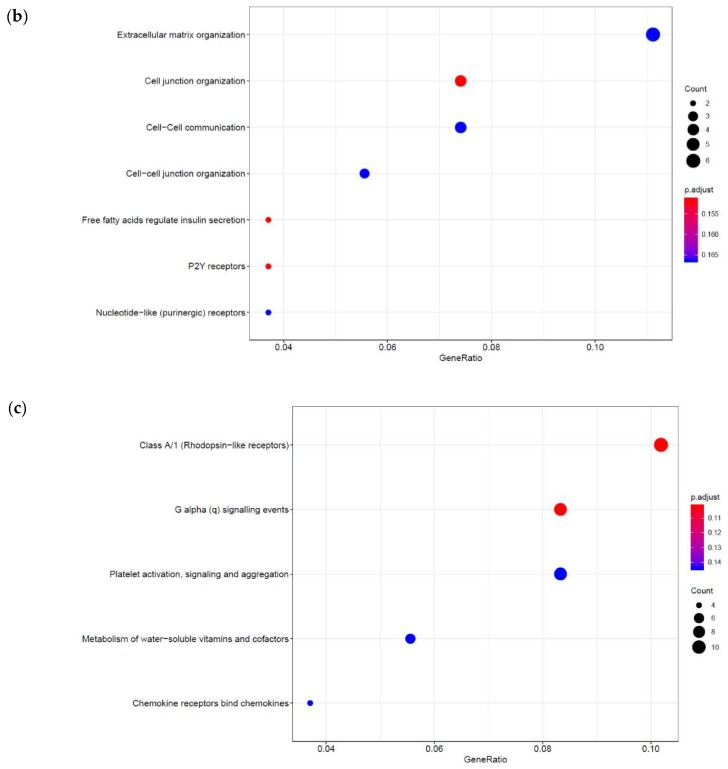
The data forming the Venn data in Figure 1 were analysed by the Bioconductor ReactomePA software package [30] to generate gene ontology (GO; y-axis) maps for significant F/R (a), I942 (b) and shared (c) genes. The x-axis represents the ratio of genes in the ontology over the total number of enriched genes. The occurrence of individual gene ontologies (count) and significance (p-adjust) are also displayed, as indicated in the key on the right of the graphs.


