Figure 6.
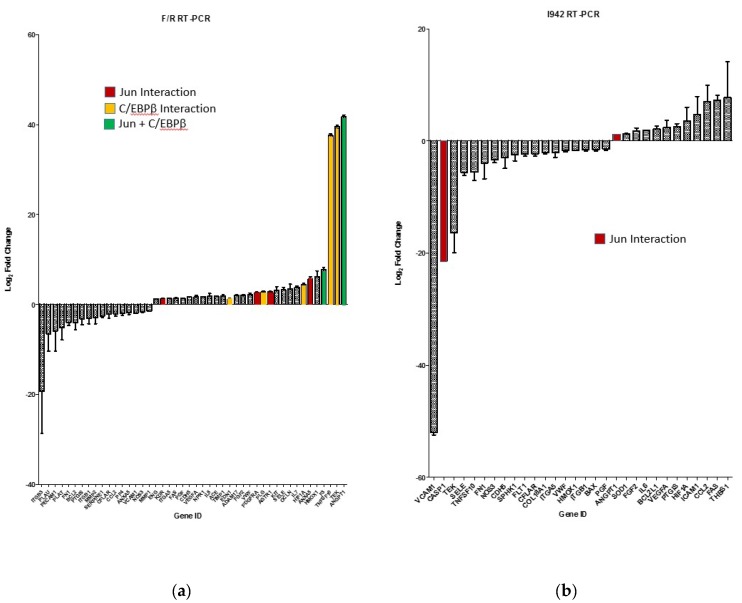
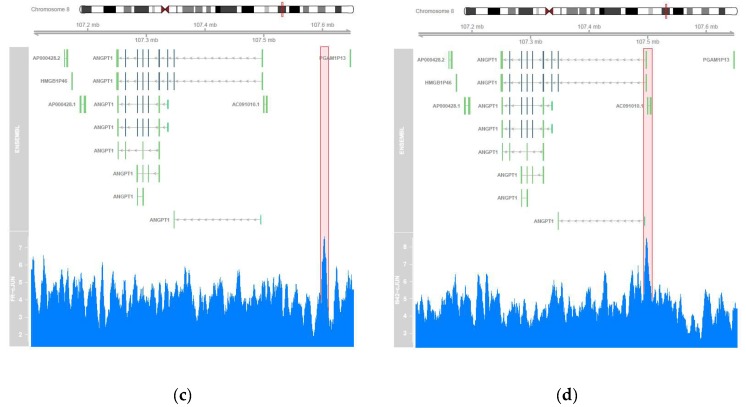
HUVECs were stimulated for 48 h with (a) F/R or (b) 100 μM I942 or and then total cell RNA was extracted and subjected to RT-PCR using a RT2 Profiler™ PCR Array for Human Endothelial Cell Biology as described in Materials and Methods. The bar graph is coloured to show genes that were identified by ChIP-SEQ as interacting with either C/EBPβ (yellow), c-Jun (red) or both C/EBPβ and c-Jun (green). Plotted in (c) and (d) is the region for ANGPT1, which interacts with c-Jun and is induced by both F/R (a) and I942 (b), along with the sequence read coverage (in blue) in that region from alignments. Stimulation with either F/R (c) or I942 (d) results in a peak immediately up-stream of the ANGPT1 gene, although the binding site appears different for each stimulus.


