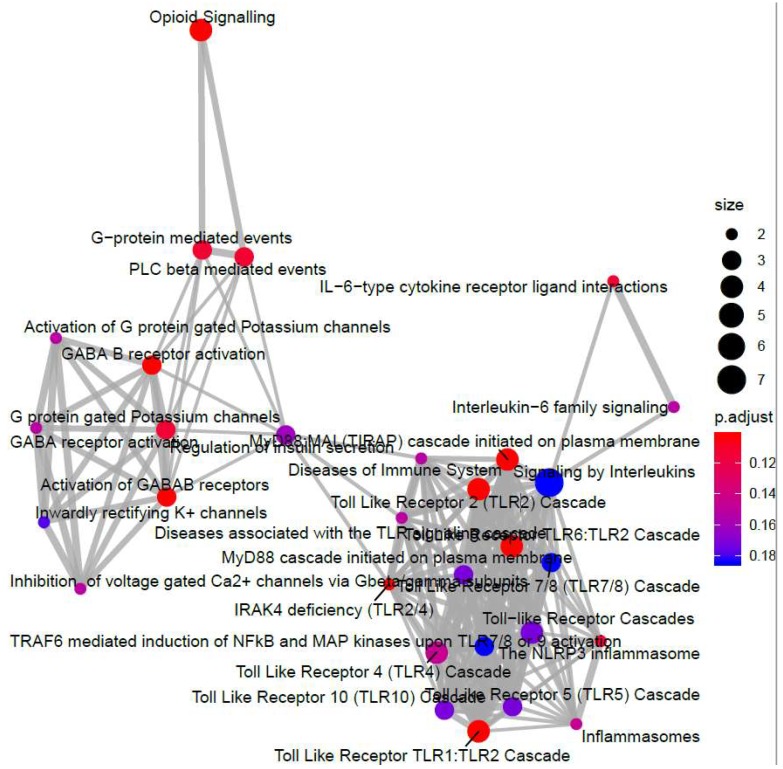
Figure 7.
The RNA-SEQ data generated for Figure 4 was re-analysed using ReactomePA software to identify gene expression changes in I942-stimulated cells that were associated with interaction with c-Jun and are presented here as a CNET plot of genes with associated functions.

