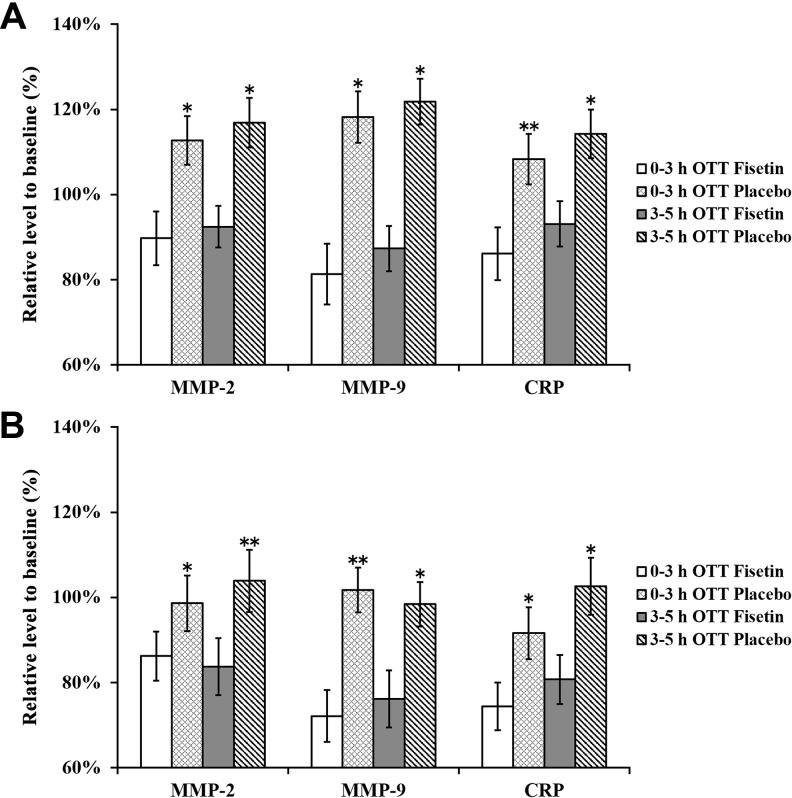
Figure 4.
Serum levels of MMP-2, MMP-9, and CRP at (A) 1 day and (B) 7 days after initial treatment. Values were normalized as percentage to baseline values in respective treatment groups and expressed as mean (SD). ∗P < .05 fisetin versus placebo treatment at respective OTT groups. CRP indicates C-reactive protein; MMP, matrix metalloproteinase; NIHSS, National Institutes of Health Stroke scale; OTT, onset-to-treatment time; SD, standard deviation.

