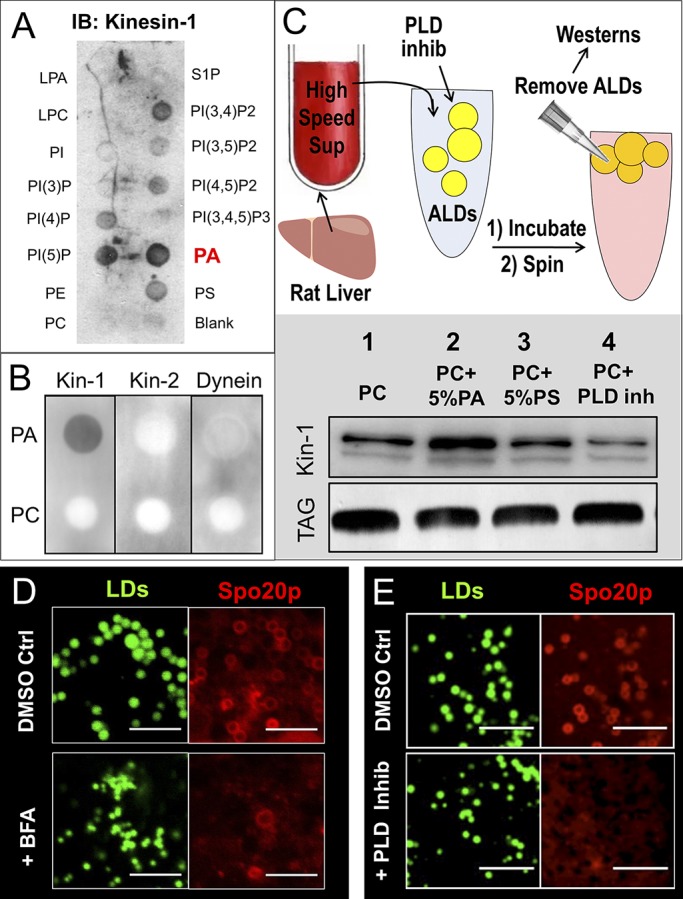
Figure 3.

PA recruits kinesin-1 to LDs. (A) BRL3A hepatocyte PNS was overlaid on nitrocellulose membrane spotted with indicated lipids. The membrane was immunoblotted (IB) against kinesin-1 antibody. Kinesin-1 exhibited the highest affinity to PA. (B) PA and PC were spotted on nitrocellulose membrane and overlaid with PNS prepared from BRL3A hepatocytes. Binding of kinesin-1, kinesin-2, and dynein was probed using antibodies against the specific proteins. Only kinesin-1 shows specificity for PA. (C) Top: Schematic of experiment. ALDs were incubated with HSS prepared from liver of fed rat. HSS is devoid of membrane, organelles, and endogenous LDs. ALDs (PC only) were also incubated with HSS in presence of 50 µM PLD inhibitor. ALDs were removed by flotation after the incubation, and ALD-bound proteins were probed with kinesin-1 antibody. Bottom: Kinesin-1 binding to ALDs visualized by Western blot against kinesin-1 antibody. TLC for TG confirms equal loading of ALDs. The blot is representative of three independent experiments. (D) COS7 cells overexpressing PA sensor protein (GFP-Spo20p) were treated with DMSO (control) or Brefeldin-A (BFA). The cells were fixed, and LDs were stained with MDH immediately before imaging. Confocal images of cells show that BFA reduced GFP-Spo20p binding to LD membrane. Scale bar = 2 µm. (E) Same as D, but cells treated with DMSO (control) and PLD inhibitor. Scale bar = 5 µm.
