Figure 2.
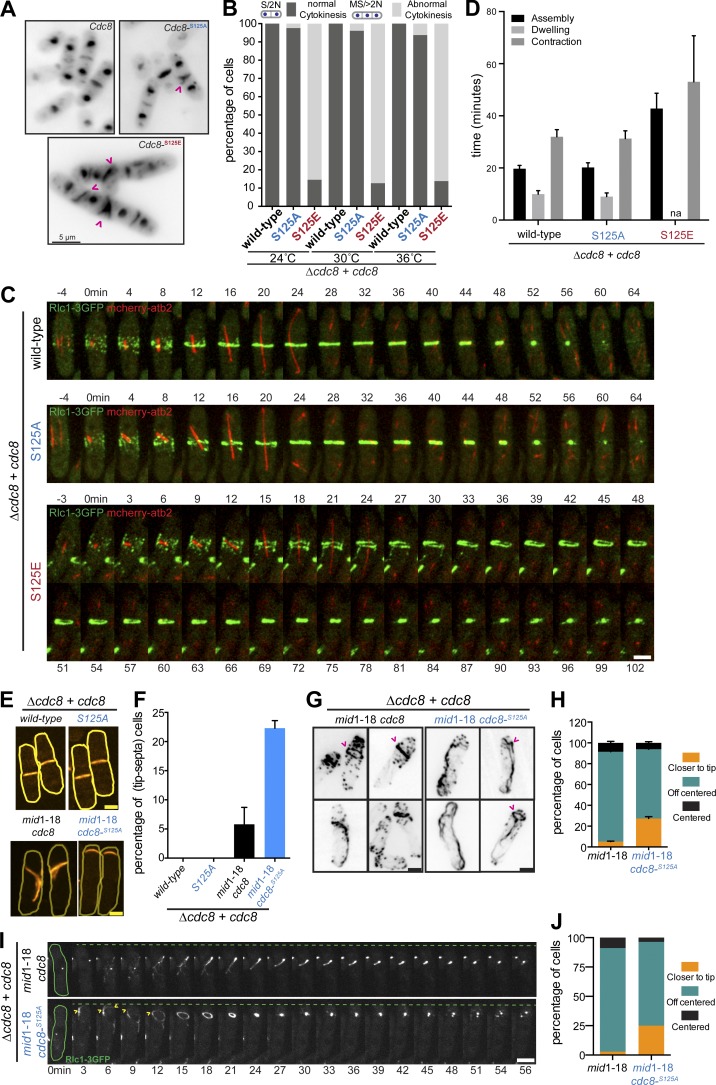
A phosphomimetic Cdc8 mutant is affected for actin cable stability, actomyosin ring assembly, and contraction. (A) Exponentially growing cdc8+, cdc8-S125A, and cdc8-S125E at 24°C were fixed with 4% PFA. DAPI and anillin blue staining were used to visualize the DNA and septum. Abnormal septa in cdc8-S125E mutants (∼85% from >200 cells examined in two independent experiments) and split septa in cdc8-S125A (∼3% from two independent experiments; 200 cells with septa examined in each case) are highlighted with pink arrows. Scale bar represents 5 µm. (B) Quantification of cytokinetic defects in A. cdc8, cdc8-S125A, and cdc8-S125E cells following staining with DAPI (nucleus) and anillin blue (septa; n >300 each). (C) Time-lapse series of log-phase cells of the indicated genotypes (cdc8 [n = 23], cdc8-S125A [n = 36], and cdc8-S125E [n = 24]) expressing 3GFP-tagged myosin regulatory light chain (rlc1-3GFP) and mCherry-tagged tubulin (mCherry-atb2). Cells were grown at 24°C and imaged at 24°C. Images shown are maximum-intensity projections of z-stacks. Scale bar represents 3 µm. (D) Quantification of C. Timings of ring assembly, maturation, and contraction are shown. na, not applicable. (E) Exponentially growing WT, cdc8-S125A, mid1-18 cdc8, and mid1-18 cdc8-S125A were shifted from 24°C to 36°C for 3 h and stained with anillin blue. Scale bar represents 3 µm. (F) Quantification of septum position in E. n > 120 cells each, from two independent experiments. (G) Exponentially growing mid1-18 and mid1-18 cdc8-S125A were shifted from 24°C to 36°C for 3 h, fixed, and stained for actin structures with CF-633-phalloidin. Scale bar represents 3 µm. (H) Quantification of the actin ring position in G (n > 150 cells each, from two independent experiments). (I) Time-lapse series of exponentially growing mid1-18 [n = 34] and mid1-18 cdc8-S125A [n = 28] cells expressing (rlc1-3GFP). Cells were grown at 24°C and shifted to 36°C for 3 h before imaging. Images shown are maximum-intensity projections of z-stacks. Scale bar represents 3 µm. (J) Quantification of the actomyosin ring position in I (mid1-18, n = 34; mid1-18 cdc8-S125A n = 28). Error bars represent SD.

