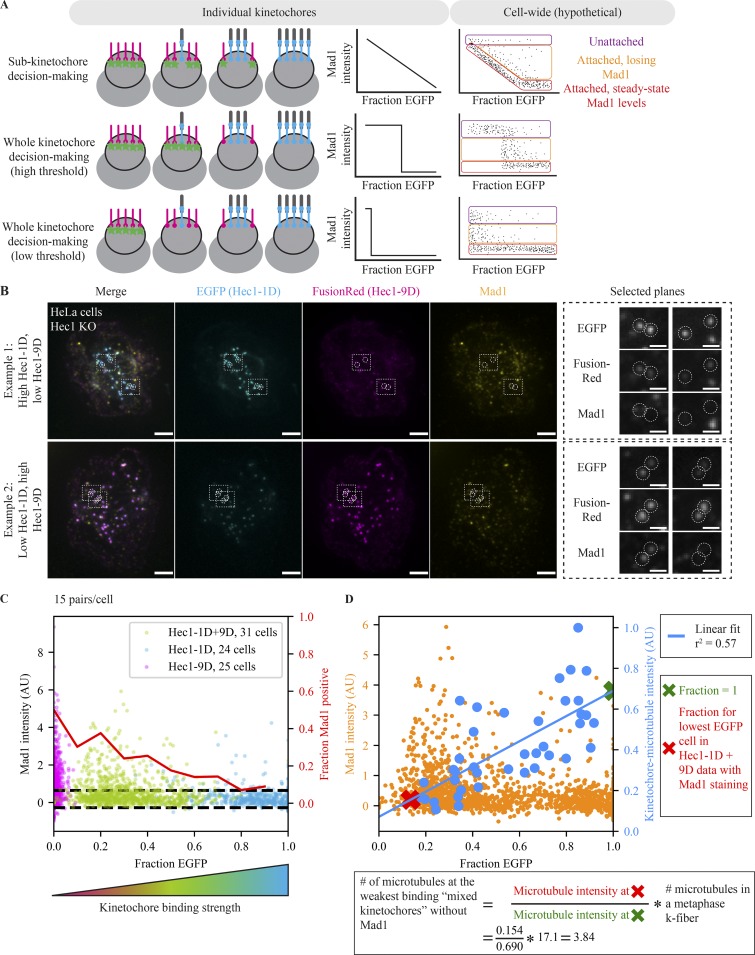
Figure 2.
The number of attached microtubules regulates steady-state Mad1 localization in a switch-like, highly sensitive manner. (A) Schematic depicting models for kinetochore signal integration and expected hypothetical outcomes. The kinetochore processes microtubule attachments either as many individual units (top) or as one single unit (switch like) with a high (middle) or low (bottom) threshold. On the cellular scale, we expect three kinetochore populations: completely unattached (purple), attached and in the process of losing Mad1 (orange), and at attached steady-state Mad1 levels (red). The relative number of kinetochores in each population is arbitrary. (B) Immunofluorescence imaging (maximum-intensity projection) of SAC activation (Mad1), Hec1-1D intensity (anti-EGFP), and Hec1-9D intensity (anti-mKate, binds to FusionRed) in Hec1 knockout cells expressing both Hec1-1D-EGFP and Hec1-9D-FusionRed. Cells were treated with 5 µM MG132 to accumulate them at a metaphase spindle steady state. The two examples are cells on the same coverslip, where the top has a high Hec1-1D to -9D ratio and the bottom a low ratio. Kinetochores in both conditions are capable of recruiting (left zoom) and losing (right zoom) Mad1. Scale bars = 3 µm (large) and 1 µm (zoom). (C) Fraction EGFP versus Mad1 intensity from mixed kinetochore cells in B (n = 930 kinetochores, 31 cells; green) and cells with control Hec1-1D (n = 720, 24; blue) and Hec1-9D (n = 750, 25; pink) alone. Red line indicates the fraction of kinetochores with Mad1 intensities 1 SD (dashed black lines) greater than average Mad1 intensity on Hec1-1D kinetochores. (D) Fraction EGFP versus Mad1 intensity (B and C) or average end-on attached microtubule numbers (Fig. 1, B–D) for Hec1-1D alone and Hec1-1D + -9D conditions. Blue line indicates linear fit for cellular average fraction EGFP versus cellular average kinetochore–microtubule intensity (r2 = 0.57, P = 10−8). Xs indicate the points along the fit used for the calculation of attached microtubule number (red, average fraction EGFP for the lowest fraction EGFP cell in mixed kinetochores in which some kinetochores are Mad1-negative; green, fraction EGFP of 1). Calculation of the number of microtubules at the weakest binding mixed kinetochores without Mad1 uses the average number of microtubules in a metaphase k-fiber from Wendell et al. (1993) (see Materials and methods). All data displayed was acquired at the same time for all conditions and with the data in Fig. 1. Alternative estimation methods lead to similar estimates (Fig. S2 B).

