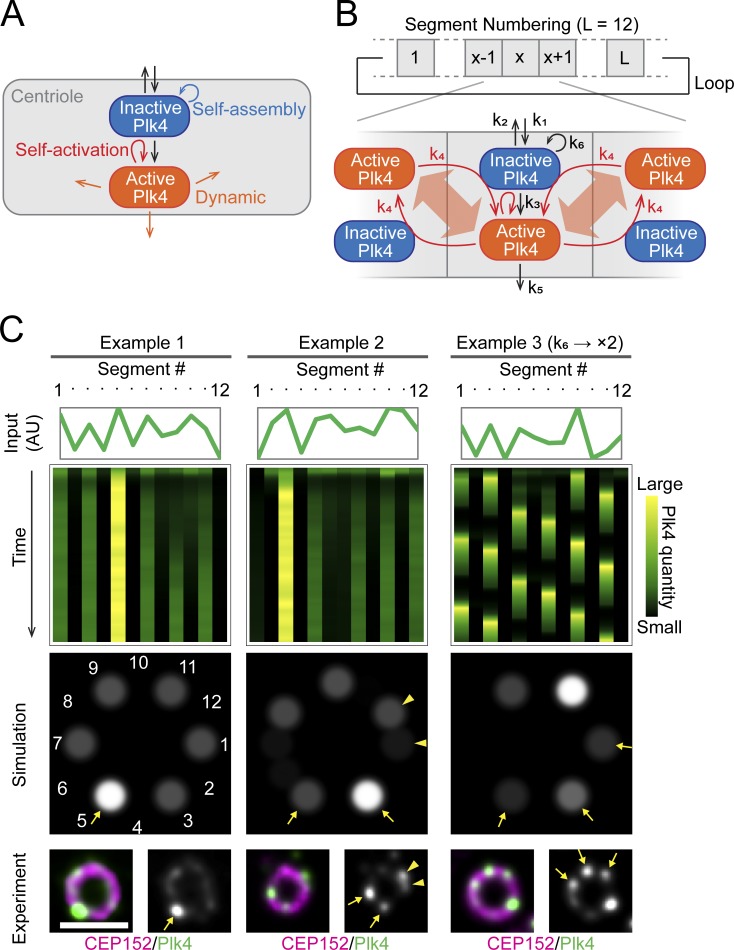
Figure 3.
Simulations of the pattern formation of Plk4 based on the LI model. (A) The core concept of the theoretical model. The self-organization properties of Plk4 result in its lateral-inhibition self-patterning behavior. (B) Schematic drawing of the LI model. (C) Examples of simulation results. Array plots showing the time course of pattern formation, with the initial quantities of Plk4 indicated in the line graphs above (Input), and the spatial pattern at the last time point (Simulation) are shown for each example. Representative STED images resembling the simulation results are shown at the bottom (Experiment). The arrows and arrowheads indicate the similarities in the patterns between the simulation and the actual observation. The basic parameter setting was used for examples 1 and 2, but k6 was doubled for example 3. Scale bar, 0.5 µm.

