Figure 4.
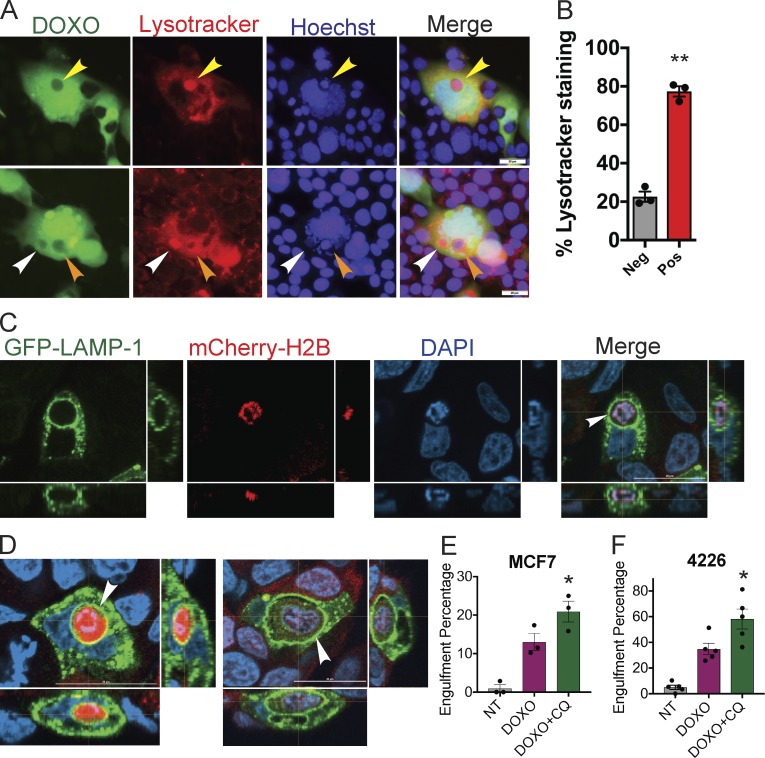
Engulfed cells are processed to the lysosome. (A) GFP-expressing 4226 cells were treated with 0.75 µM doxorubicin (DOXO) for 24 h and then co-plated with clear (uninfected), NT 4226 cells. After 7 d, LysoTracker and Hoechst dye was added to cocultures, followed by imaging. Arrowheads indicate clear cells within GFP-expressing senescent cells in various states of Hoechst and LysoTracker positivity. Scale bar represents 20 µm. (B) LysoTracker staining was quantitated in three separate 4226 engulfment experiments. A total of 103 senescent cells were found to have engulfed another cell and were counted. LysoTracker-positive vesicles that were both DAPI positive and completely surrounded by GFP cytoplasm from the engulfing cell were counted as positive, while vesicles that were also completely surrounded by GFP and were DAPI positive but were not LysoTracker positive were counted as negative. Significance determined by unpaired t test; **, P < 0.001. (C and D) MCF-7 cells expressing LAMP1-GFP were treated with doxorubicin and then co-plated with NT mCherry cells. 7 d later, cells were fixed and confocal microscope images were captured in three channels and merged. Z-stack projections are shown adjacent and below. Representative images shown. Scale bar represents 20 µm. Z-stack projections display 15 images taken 2 µm apart with a total z range of 28.02 µm for C, 22 images taken 1 µm apart for a total of 20.48 µm (D, left), and 33 images taken 1 µm apart totaling 31.72 µm (D, right). (E and F) Cells expressing GFP were doxorubicin treated or not for 24 h and then co-plated as in Fig. 2 (E and F). 5 d after plating, vehicle or chloroquine was added to final concentration of 20 or 10 µM for MCF-7 and 4226, respectively, and 2 d later MCF-7 (E) and 4226 (F) were fixed and DAPI stained. Engulfment percentage was determined for NT cells mixed with NT cells (gray bar), doxorubicin-treated cells mixed with NT cells (DOXO, purple bars), and doxorubicin-treated cells mixed with NT cells followed by chloroquine treatment (DOXO+CQ, green bars). Three (E) and five (F) individual experiments were performed; *, P < 0.05 determined by unpaired t test between doxorubicin treated with or without chloroquine. Errors bars represent SEM.

