Figure 5.
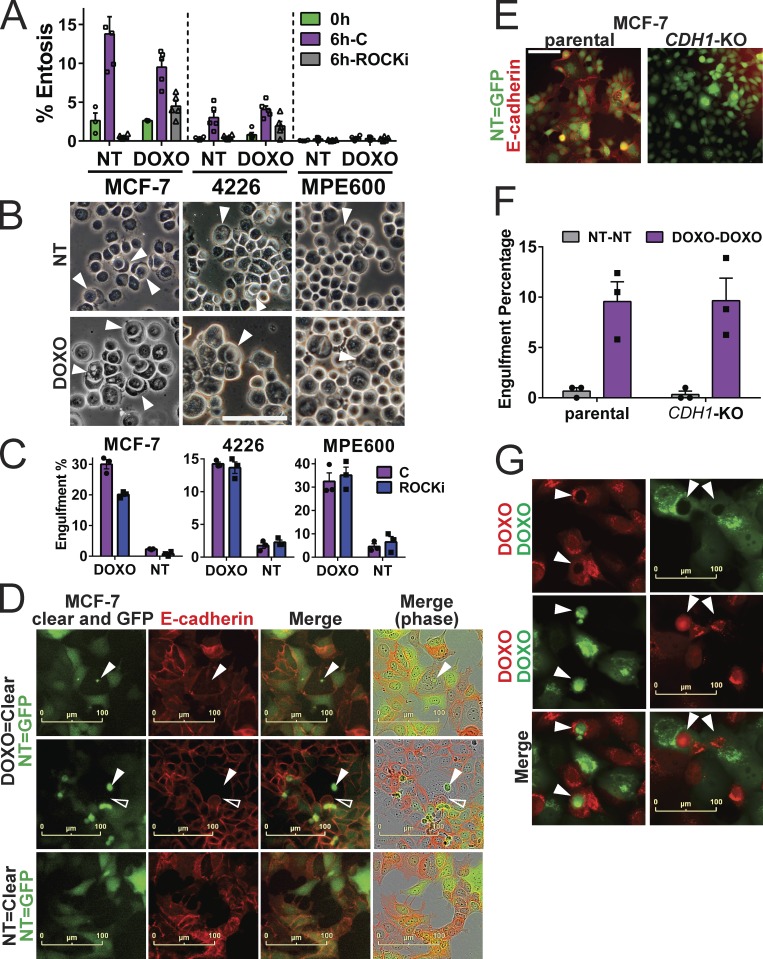
Engulfment by doxorubicin (DOXO)-induced senescent cells is distinct from e-cadherin–dependent entosis. (A and B) MCF-7, 4226, and MPE600 cells, proliferating and 8 d after doxorubicin treatment, were placed in suspension in low-adhesion plates in the presence or absence of 10 µM ROCK inhibitor Y-27632 (ROCKi) for 6 h, followed by cytospin, fixation, and imaging, along with cells cytospun immediately after suspension (0 h). (A) Number of entosis cells and total number of cells from high-power phase fields were quantified and percentages were graphed. Individual data points are shown; error bars represent SEM. Data represent at least two separate experiments. (B) Representative examples of NT cells and cells 8 d after doxorubicin (DOXO) treatment undergoing entosis, denoted by white arrowheads. Scale bar represents 50 µm. (C) Indicated cell lines were doxorubicin treated and plated for engulfment assays in triplicate as in Figs. 2 E and 3 A. In an additional group, 10 µM ROCK inhibitor Y-27632 was added every other day. Cultures were followed up to 8 d after doxorubicin on an IncuCyte, and cell-in-cell structures were quantified and graphed on day 8. Graphs show mean percentages from triplicate wells (all three data points are shown) of GFP-expressing cells (NT or DOXO) with an NT mCherry-expressing cell inside them. Error bars represent SEM. Data shown are representative of at least two independent experiments. (D) Untreated GFP-expressing MCF-7 cells (NT) were plated as in Fig. 2 E with NT or doxorubicin-treated (DOXO) clear MCF-7 parental cells. Cultures were followed for 5 d on IncuCyte, and cells were fixed, stained for e-cadherin (CDH1), and imaged on IncuCyte again. Shown are representative images of senescent clear cells that had previously engulfed another cell (indicated by arrowheads, verified in time lapse to be a live cell engulfment) making contact with NT cells (top two panels; open arrowhead indicates an NT cell intruding into the senescent cell). Lower panel shows e-cadherin staining of contacts made between NT clear and NT GFP-expressing cells. (E) MCF-7 cells with knockout of the gene for e-cadherin (CDH1-KO) and the parental line from which they were derived were stained for E-cadherin. Scale bar represents 50 µm. (F) GFP- and mCherry-expressing MCF-7 parental and CDH1-KO cell lines were plated and doxorubicin treated in triplicate as in Fig. 2 C. Cultures were imaged on IncuCyte, and 6 d after doxorubicin, cell-in-cell structures were quantified and graphed to show mean percentages of GFP-expressing cells (NT-NT or DOXO-DOXO) with an mCherry-expressing cell inside them (all three data points are shown). Error bars represent SEM. Data shown are representative of two independent experiments. (G) Representative images of engulfments occurring in cultures from F. Arrowheads indicate engulfed treated cells within other treated cells from both MCF-7 parental and CDH1-KO cells. Scale bar represents 100 µm. Data shown are representative of at least two independent experiments.

