Fig. 2.

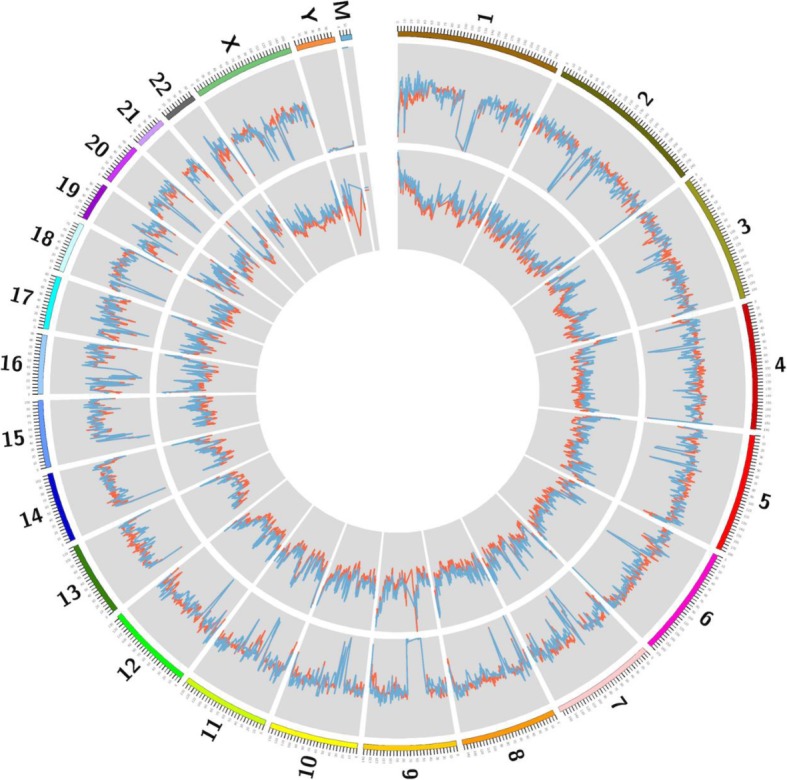
Comparison of whole genome distribution between evDNA (blue) and cfDNA (red) using EV16 as an example. Image was generated by Circos software (outer to inner: reads ratio; GC content)

Comparison of whole genome distribution between evDNA (blue) and cfDNA (red) using EV16 as an example. Image was generated by Circos software (outer to inner: reads ratio; GC content)