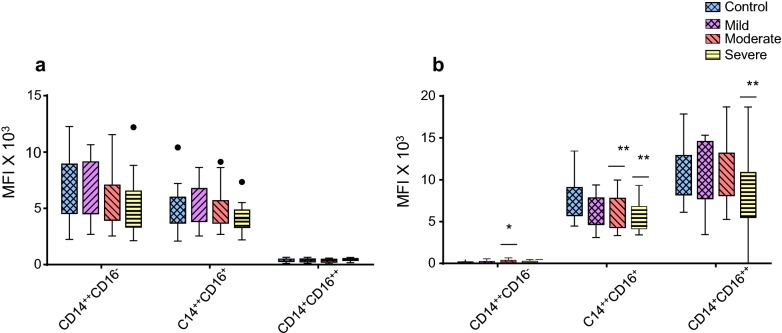
Fig. 3.
Comparative analysis of CD14 expression (a) and CD16 expression (b) on monocyte subsets from mild asthmatic patients (n = 22), moderate asthmatic patients (n = 32) and severe asthmatic patients (n = 22) compared to healthy control (n = 35). Each monocyte subset is shown as box groups (as defined in Fig. 2) where the left box indicates healthy subjects and the next boxes indicate mild, moderate and severe asthmatic patients respectively. Gating was performed as in Fig. 1 and significance, compared to healthy controls, was calculated using Holm–Sidak unpaired multiple comparison test and is indicated with *(p < 0.05), **(p < 0.01)

