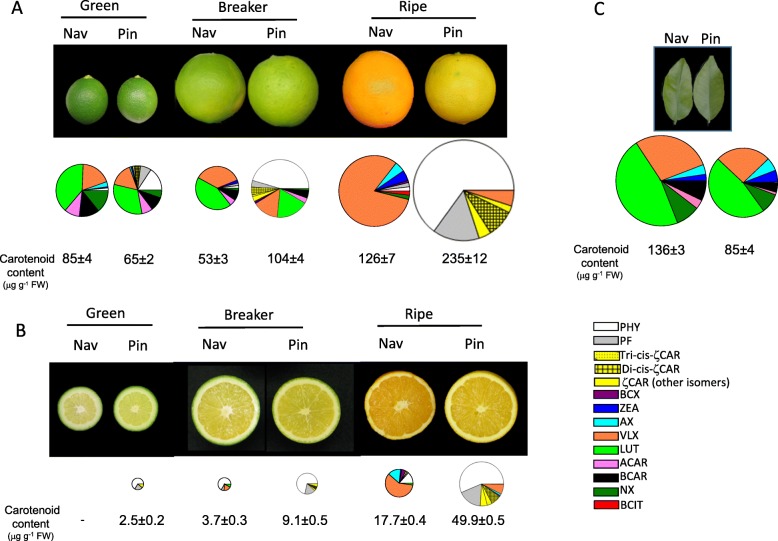
Fig. 2.
External (a) and internal (b) aspect of parental ‘Navelate’ (Nav) and mutant ‘Pinalate’ (Pin) fruits at immature green, breaker and full ripe stage, and young leaves (c). Graph pies represented the distribution of individual carotenoids, as percentage of total carotenoid content, in the corresponding Nav and Pin samples, and data below indicate the total carotenoid content (μg g− 1 FW). Note that pie graphs are proportional to the total carotenoid content

