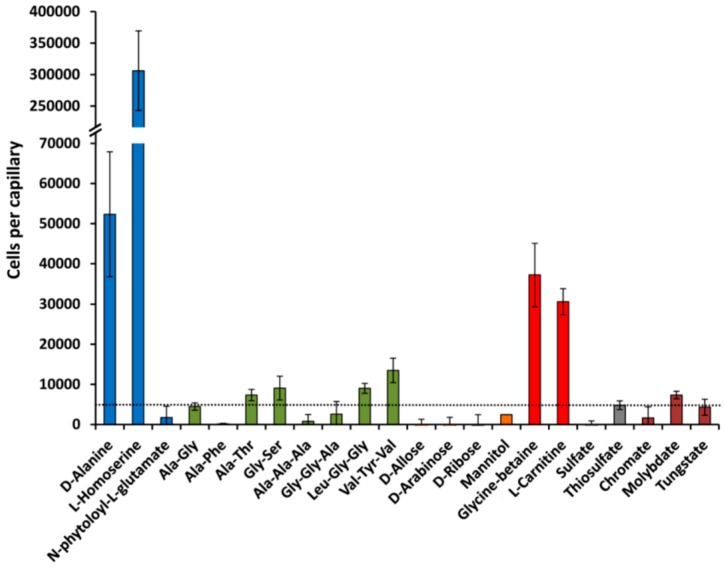
Figure 10.
Chemotaxis of Pseudomonas aeruginosa PAO1 towards different ligands recognized by solute binding proteins. In all cases, the chemoeffector concentration was 1 mM, except molybdate which was at 0.1 mM. Data are means and standard deviations from three biological replicates conducted in triplicate. Data were corrected with the number of cells that swam into buffer containing capillaries.

