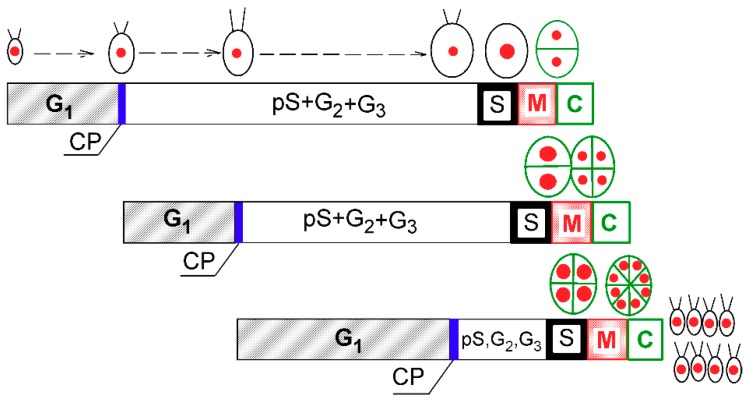
Figure 1.
Schematic diagram of growth and the cell cycle in a single cell of Chlamydomonas reinhardtii. The schematic pictures reflect increasing cell size. The red full circles inside the cells illustrate the size and number of nuclei. Larger red circles indicate a doubling of DNA. Green ellipsoids and lines represent protoplast division. Diagram shows a model of cell cycle progression in C. reinhardtii dividing by multiple fission into 8 daughter cells. Three bars indicate three overlapping growth and reproductive sequences terminated by division into 2, 4, and 8 daughter cells, respectively. Precommitment period (G1): the period until threshold critical cell size for commitment to divide (CP) is reached and CP is attained. Postcommitment period consists of pS—the prereplication phase between the CP attainment and the beginning of DNA replication. The processes required for initiation of DNA replication are assumed to happen during this phase. S: DNA replication takes place. G2: the phase between the termination of DNA replication and the start of mitosis (M). Processes leading to the initiation of mitosis are assumed to take place during this phase. G3: the phase separating mitosis from cellular division, which is clearly visible in some algae dividing by multiple fission. The processes leading to cellular division are assumed to take place during this phase. C: the phase during which cell cleavage (protoplast fission) and daughter cell formation occurs. For C. reinhardtii, it is typical that all “gap” phases are combined into one prolonged phase. The distances between individual cell cycle phases correspond to the cell cycle progression in a real culture (Figure 2). Modified after Zachleder et al. [13], Bišová and Zachleder [14], and Zachleder et al. [15].

