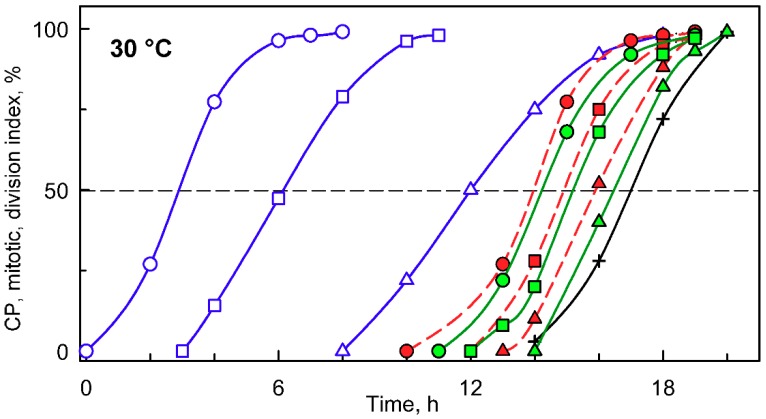
Figure 2.
Graphical representation of the cell cycle progression in synchronized cultures of the Chlamydomonas reinhardtii grown at 30 °C at an incident light intensity of 500 μmol m−2 s−1. Time courses of individual commitment point/s, nuclear division/s, protoplast fission/s, and daughter cell release in synchronized cultures of C. reinhardtii. Blue curves (CP indices): cumulative percentage of cells, in a given population (100%), that attained the commitment point (CP) for the first (circles), second (squares), and third (triangles) reproductive sequence. Red curves (mitotic indices): cumulative percentage of cells, in a given population (100%), that divided their nuclei into 2 (circles), 4 (squares), and 8 (triangles). Green curves (division/protoplast fission indices): cumulative percentage of cells, in a given population (100%), that divided their protoplasts into 2 (circles), 4 (squares), and 8 (triangles). Black curve, crosses: cumulative percentage of cells that released daughter cells. Black dashed line at 50% depicts midpoint of each event in a population of cells.

