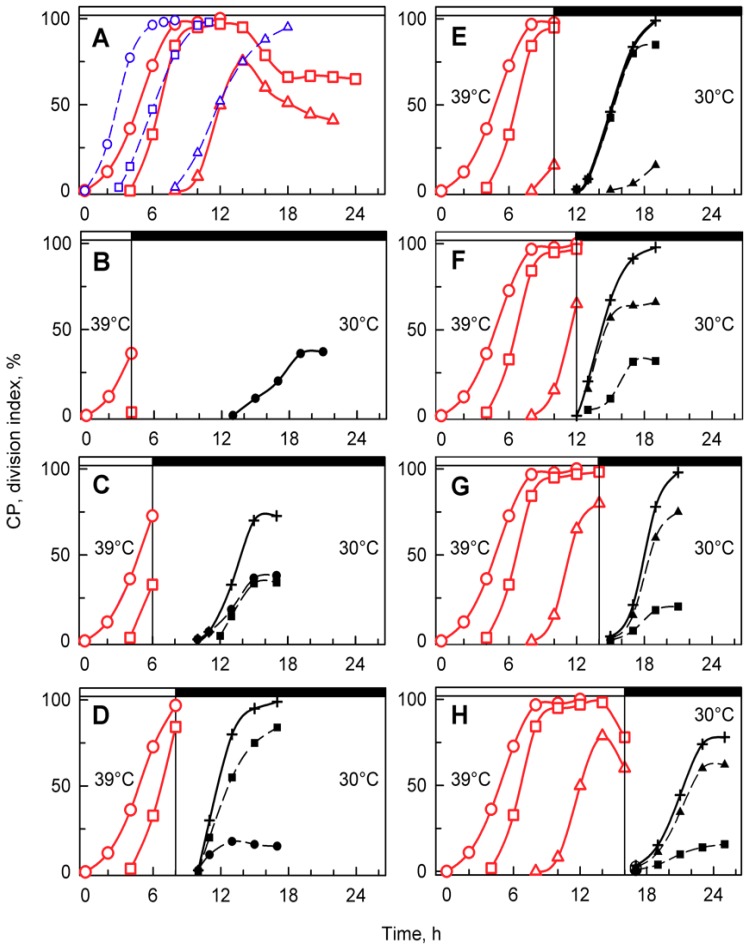
Figure 5.
Time courses of individual CPs and cellular divisions in synchronized populations of Chlamydomonas reinhardtii. Panel A, the cells were grown in light at 30 °C (blue lines) or 39 °C (red lines); panels B–H, the cells were grown at 39 °C and then placed in the dark after 4, 6, 8, 10, 12, 14, and 16 h, respectively, and kept at 30 °C. No cell divisions occurred at 39 °C (A). Blue lines (CP indices): cumulative percentage of cells in a given population (100%) grown at 30 °C that attained commitment points (CPs) for the first (circles), second (squares), and third (triangles) reproductive sequences. Red lines (CP indices): the cells were grown at 39 °C and transferred bihourly to the dark at 30 °C. The cumulative percentage of 2, 4, and 8 daughter cells released in the dark in a given population (100%) is plotted as the attainment of the commitment points for the first (circles), second (squares), and third (triangles) reproductive sequences. Black dashed lines (division indices): cumulative percentage of cells that completed the first (full circles), second (full squares), and third (full triangles) cellular divisions and released 2, 4, or 8 daughter cells in a given population (100%). Black full lines, crosses: cumulative percentage of all cells in a given population (100%) that released daughter cells at 30 °C in dark. Times of transfer into darkness at 30 °C are indicated by vertical lines and by dark boxes above the graphs.

