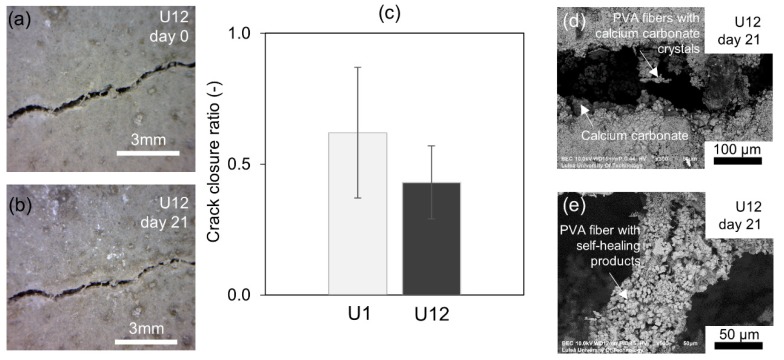
Figure 10.
(a) Light microscope images of the crack before healing for sample U12; (b) light microscope images of the crack after 21 days of healing for sample U12; (c) crack closure ratio for samples U1 and U12; (d) SEM BSE images (300×) of the crack at the surface for sample U12; (e) SEM BSE images (300×) of the self-healing products deposited on the PVA fiber in specimen U12.

