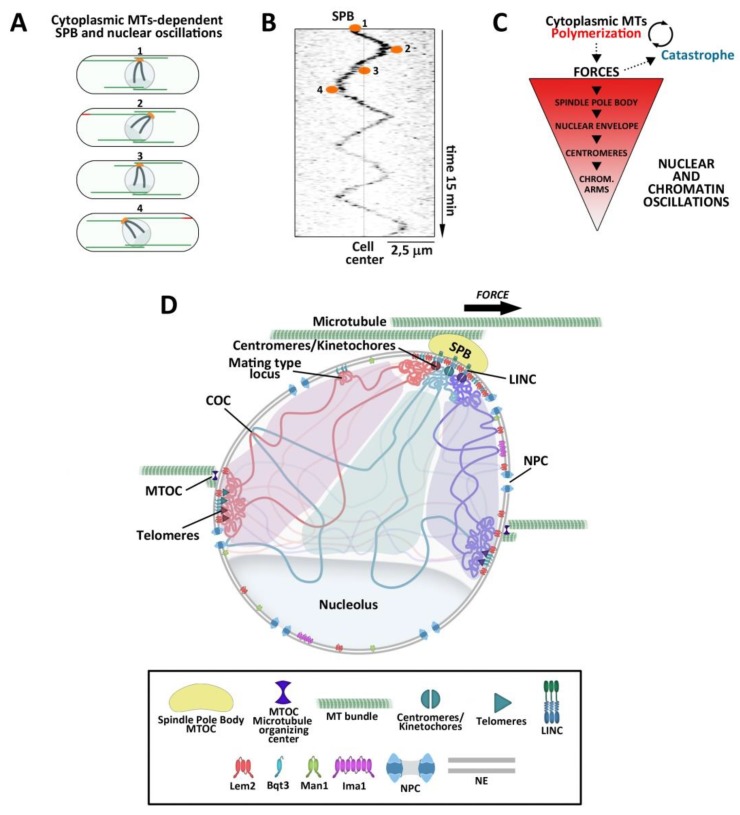
Figure 3.
Fission yeast nucleus-SPB and NE under the forces produced by MTs. (A) Schematic representation of a fission yeast cell over time. The nucleus suffers periodic oscillations. Chromosomes are depicted as dark lines. SPB/centromeres are depicted in orange. MTs are depicted in green. The red color at MT ends represent stronger forces. (B) Image of the SPB (marked with GFP) showing regular oscillations around the cell center. Numbers correspond to those marked in A. Nuclear and SPB oscillations depend on alternative MT pushing (by polymerization) at each cell tip. (C) Schematic representation of the transmission of forces produced by cytoplasmic MTs to the chromatin, coupled to MT dynamics. (D) Schematic representation of a fission yeast nucleus under MT-dependent forces applied to the SPB, NE, and centromeric regions. Tethering of chromatin to the NE through INM proteins contributes to support nuclear mechanics. Notice that forces produced by other non-SPB MT bundles at other sites of the NE are not shown.

