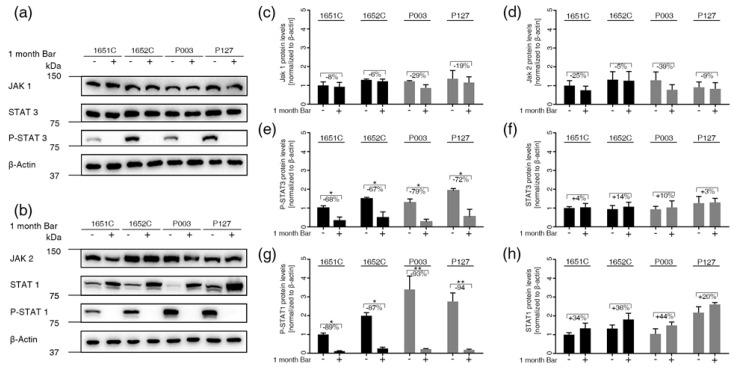
Figure 4.
Status of the JAK-STAT signaling pathway in normal and HGPS cells treated with 1 μM Bar. (a,b) Representative images of western blots for JAK1/2, STAT1/3, P-STAT1/3 and β-actin in normal (GMO1651c, and GMO1652c) and HGPS (HGADFN003, and HGADFN127) cells treated as indicated. Cultures exhibiting <5% senescence were treated with Bar or DMSO for a period of one month. (c) Quantification of JAK1, (d) JAK2, (e) P-STAT3, (f) STAT3, (g) P-STAT1, and (h) STAT1. Graphs show the mean ± SD. Protein levels were compared by two-tailed t test (* p < 0.05, ** p < 0.01, *** p < 0.001, n > 3).

