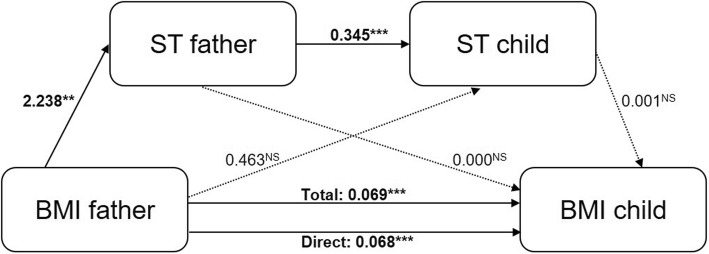
Fig. 4.
Model 2 of the serial mediation analyses. The association between BMI of the father and BMI of the child through respectively ST of the father (M1) and ST of the child (M2), with each pathway in the serial mediation model. Each arrow with a solid line represents a significant path between variables, an arrow with a dashed line represents a non-significant path. The estimated coefficients are unstandardized. Note. *p-value is significant at the 0.05 level, **p-value is significant at the 0.01 level, ***p-value is significant at the 0.001 level, NSnon-significant p-value

