
Fig. 3.
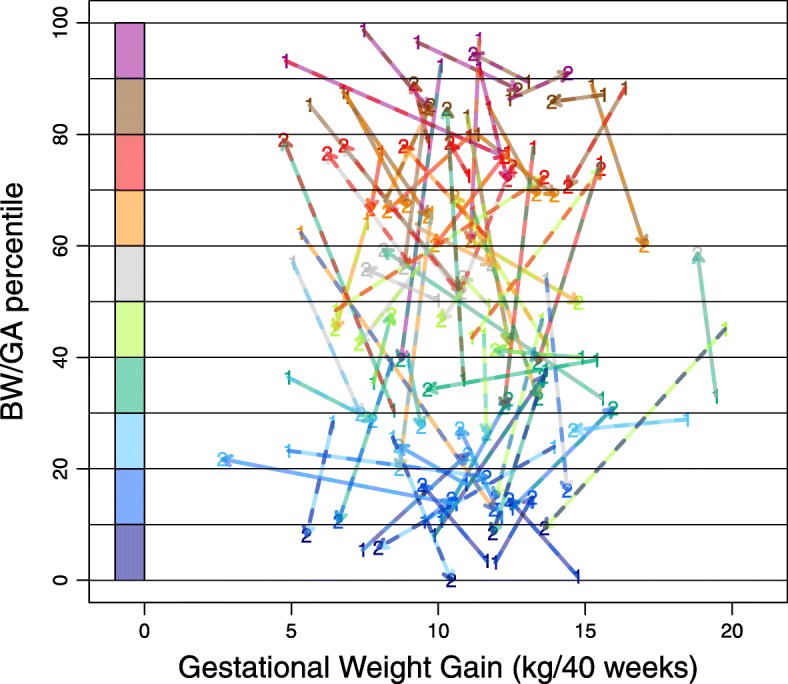
Visualization of inter-pregnancy changes in gestational weight gain and birth weight for gestational age percentiles. Scatter plot showing the relationship between gestational weight gain (GWG) and birth weight for gestational age (BW/GA) percentiles for the first and second deliveries: 1 indicates the first delivery and 2 indicates the second delivery. The “1” and “2” points are connected with arrows. Each arrow represents a unique individual. Color codes showing distinct BW/GA percentile ranges are indicated on the left. BMI, body mass index; BW/GA, birth weight for gestational age; GWG, gestational weight gain.