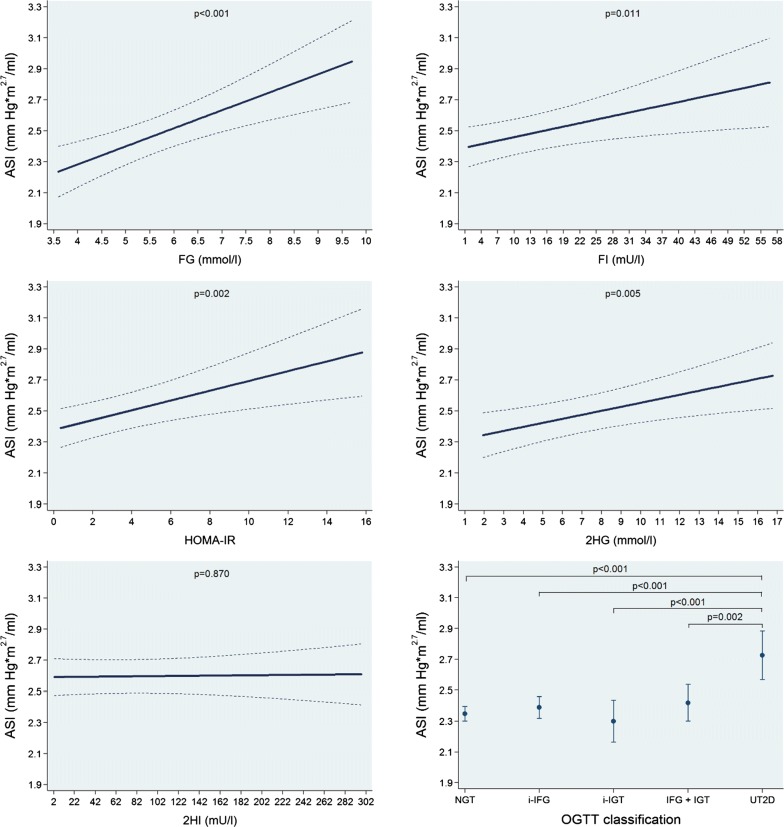
Fig. 4.
Adjusted* line (95% CI) showing the associations between fasting glucose (FG) and insulin (FI), the homeostasis model assessment-insulin resistance index (HOMA-IR) and 2-h postload glucose (2HG) and insulin (2HI) with arterial stiffness index (ASI). Adjusted* mean (95% CI) ASI according to oral glucose tolerance test (OGTT) classification: normal glucose tolerance (NGT), isolated impaired fasting glucose (i-IFG), isolated impaired glucose tolerance (i-IGT), combined IFG and IGT (IFG + IGT) and unknown type 2 diabetes (UT2D). *Linear regression adjusted for age, sex, body fat-free mass, body fat mass, systolic blood pressure, use of antihypertensive medication, smoking status, alcohol consumption, sedentarism, estimated glomerular filtration rate, fasting time and study sample

