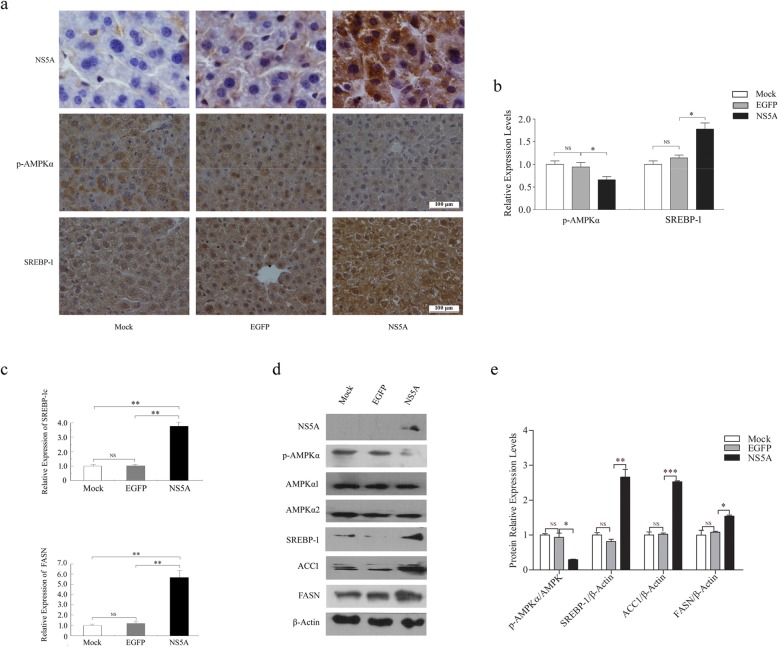
Fig. 2.
NS5A regulates the expression of lipogenic genes in vivo. a Representative IHC staining for NS5A, p-AMPKα and SREBP-1. n = 5 animals per group. Original magnification: × 400 (p-AMPKα, SREBP-1), × 1000 (NASA). Scale bar = 100 μm. IHC, immunohistochemistry. b IHC staining intensity and area were evaluated using a semi-quantitative scoring system. c The expression levels of SREBP-1c and FASN were examined by qRT-PCR in mixed liver tissues from each group. The mRNA levels were normalized to β-Actin and relative fold changes in expression levels were compared with those of the wild-type mice in the Mock group, in which the expression was set to 1.0 (n = 5 animals per group; **P < 0.01 in the NS5A group vs. Mock or EGFP group). d The levels of p-AMPKα, SREBP-1, FASN and ACC1 in liver tissues were analyzed by Western blotting. β-Actin was used as a loading control. e The fold-change was calculated based on a densitometric analysis of the band intensities. Statistically significant differences are indicated: NS (no significance), *P < 0.05, **P < 0.01, ***P < 0.001

