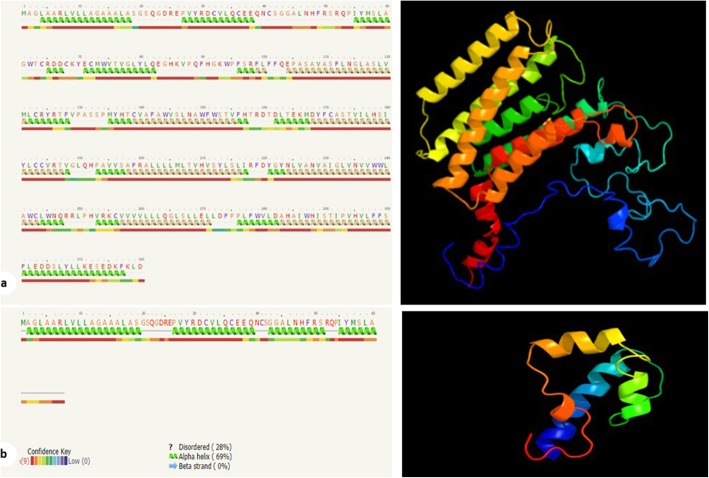
Fig. 2.
Right panel, amino acid sequence followed by secondary structure prediction. Green helices represent α-helices, and faint lines indicate coil. The line below helices indicates the confidence in the prediction, with red being high confidence and blue low confidence. The yellow helices indicate a weak prediction. Left panel, The homology modeled structure of the PGAP3 protein depicted from the Phyre2 result in cartoon format. a, wild-type protein; b, mutated protein

