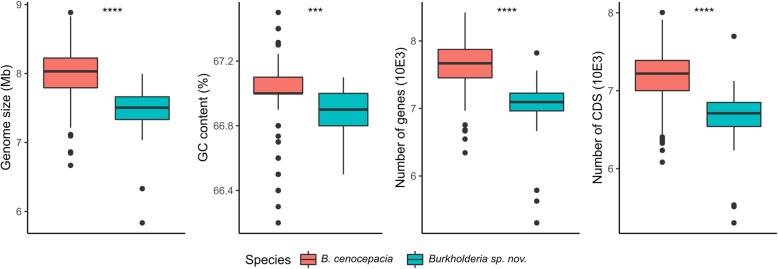
Fig. 3.
Variations in genomic organization between B. cenocepacia and Burkholderia sp. nov.. The data of 304 genomes presented in Additional file 6: Table S3 was used to represent the differences in genomic organization between B. cenocepacia and Burkholderia sp. nov. strains. Significant levels in variations were determined using Student’s t-test (p < 2.10− 4, p < 2.10− 5 for *** and **** respectively)

