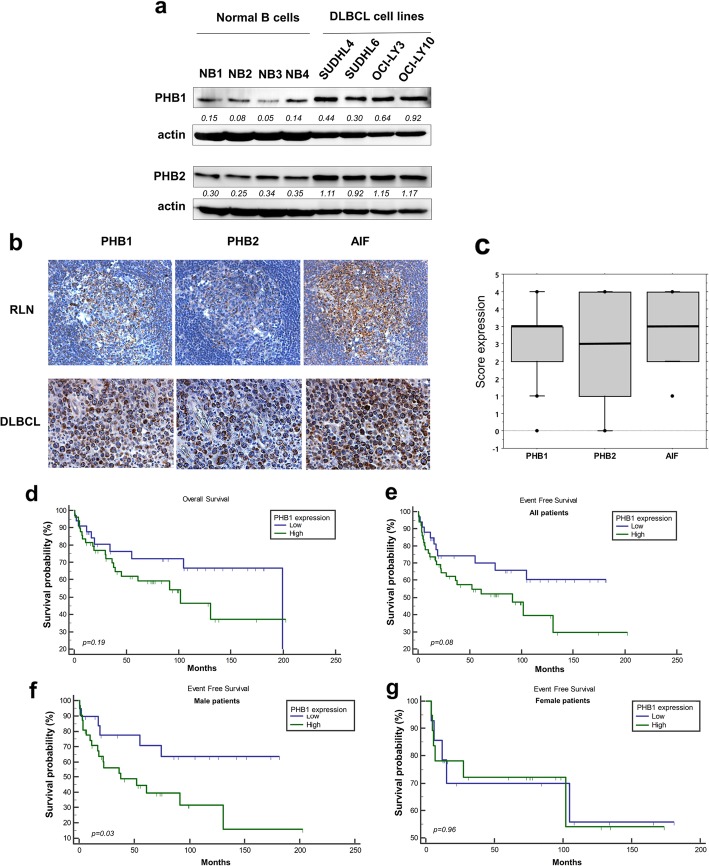
Fig. 1.
Expression of PHB1 and PHB2 in DLBCL cell lines, normal B cells and patient samples. a Expression of PHBs were analyzed by Western blotting in cell lysates of GCB (SUDHL4, SUDHL6) and ABC (OCI-LY3, OCI-LY10) DLBCL cell lines, as compared to peripheral normal B lymphocytes isolated from PBMCs of 4 healthy donors (of whom NB1 and NB2 were female and NB3 and NB4 were male donors). Actin was used as a loading control. The Western blots have been quantified by densitometry and normalized to actin intensity. The quantitative values have been incorporated below the Western blots bands. b Examples of immunohistochemical stainings of PHB1, PHB2, and AIF in DLBCL tumor samples (× 200) and normal reactive lymph nodes (RLN, × 200, n = 3). c Box-plot analysis showing the distribution of total immunostaining scores determined for the tumor samples (n = 82). The horizontal line corresponds to the median value and the box length to the interquartile range. Box whiskers represent the maximum and minimum range excluding extreme outliers (shown as dots). Kaplan-Meier plots of OS (d) and EFS (e) in patients with DLBCL (n = 82) stratified by PHB1 expression level, as indicated in the Methods section. Kaplan-Meier plots of EFS in f male (n = 48) and g female patients (n = 34)

