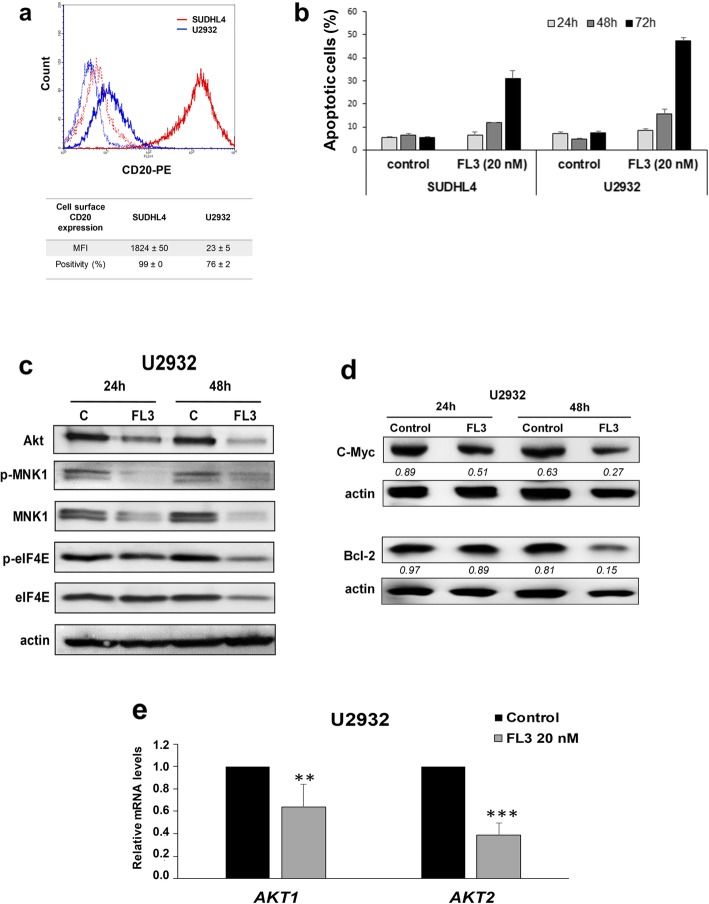
Fig. 6.
Effects of FL3 in a rituximab resistant cell line. a CD20 surface expression was determined using anti-CD20-PE by flow cytometry in U2932 cells as compared to the SUDHL4 cells. Representative histograms are shown: solid outline histograms indicate expression of CD20 in SUDHL4 cells (red) and U2932 (blue); dashed lines are the fluorescence intensity of SUDHL4 (red) and U2932 (blue) cells labeled with an isotype control mAb. Means ± SD of MFI (mean fluorescence intensity) and percentages of CD20+ cells are also done (n = 3). b The apoptotic response induced by 20 nM of FL3 was analyzed in SUDHL4 and U2932 cells at 24, 48 and 72 h by flow cytometry using the PI/Annexin V-FITC double staining as in Fig. 2. The values represent means ± SD of three independent experiments. c Akt, phopho-MNK1, MNK1, phospho-eIF4E, and eIF4E protein levels were analyzed by Western blotting after 24 and 48 h treatment (FL3, 20 nM) as compared to control (C, DMSO control). d Immunoblot analysis of Bcl-2 and c-Myc protein levels in U2932 cell cultures after 24 h and 48 h of exposure or not to FL3 (20 nM). Actin was used as a loading control. Densitometric analysis of Bcl-2 and c-Myc levels normalized to actin is indicated below the Western blot bands. e Relative quantification by qRT-PCR analysis of AKT1 and AKT2 mRNA in U2932 cell cultures in presence or not of FL3 (20 nM). Results are expressed relative to control cultures as the means ± SD of six independent experiments. **, ***: p < 0.01 or p < 0.001 respectively vs control

