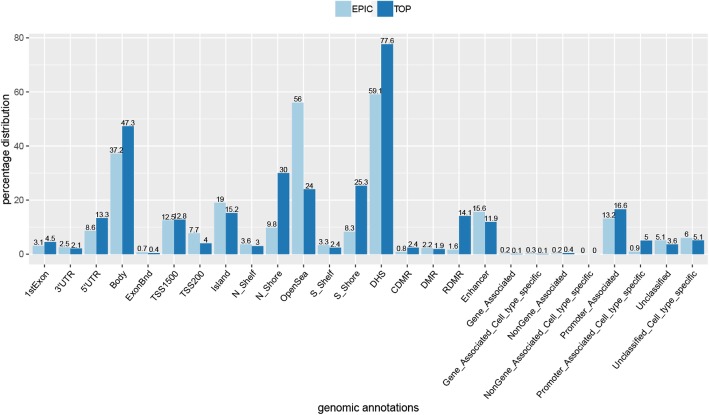
Fig. 4.
Genomic distribution of the significant differentially methylated CpG sites identified in group analysis according to the genomic annotations of the epic array. The light blue bars (EPIC) represent all the informative probes included in the data (777,148 CpGs) and the dark blue bars the CpGs identified in the group analysis (TOP; 3340 CpGs). The numbers on the top of the bars represent the percentage distribution of CpGs for each category. All categories are listed in the supplemental information—Infinium Methylation EPIC Manifest Column Headings®. This comparison demonstrates the enrichment in the body (between the ATG and stop codon), DHS–DNase I hypersensitivity site, RDMR–reprogramming-specific differentially methylated region, promoter-associated, and promoter-associated cell-type specific

